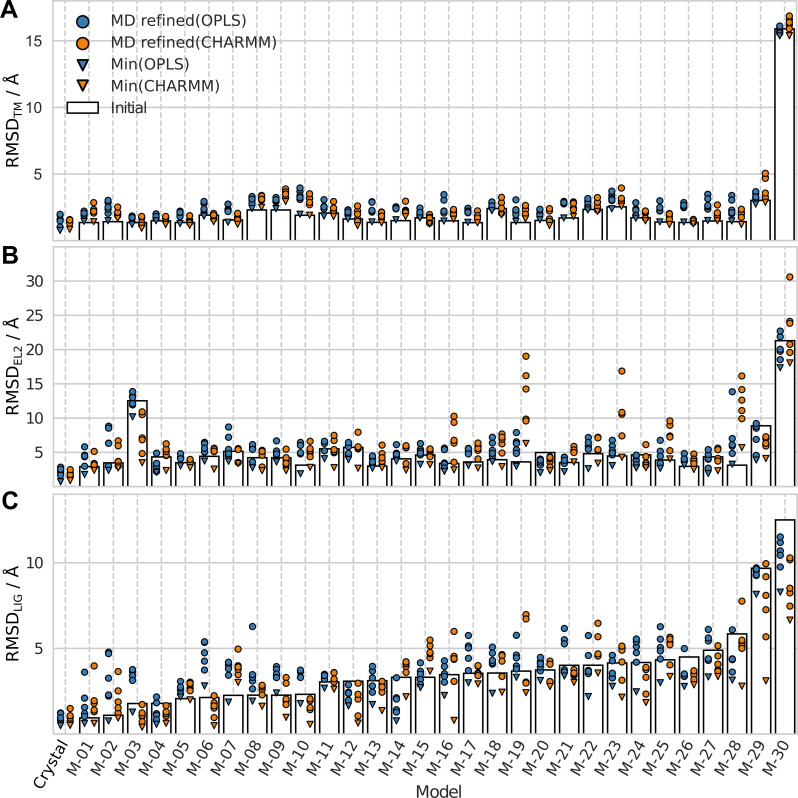
Fig 2. RMSD from crystal structure for initial and MD refined structures.
RMSDs for the initial structures (bars) and the five MD refined models (cluster centroids) from the OPLS (blue circles) and CHARMM (orange circles) protocols. The minimum RMSD values from the MD simulations are shown as triangles. The RMSD values were calculated for the (A) TM region, (B) EL2, and (C) ligand (LIG).

