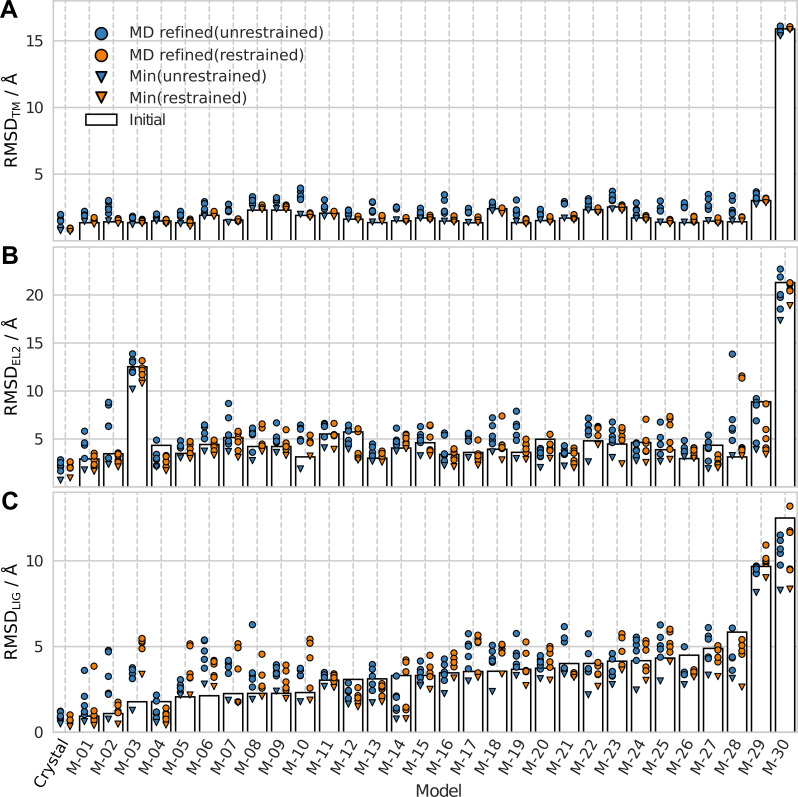
Fig 9. Comparison of MD refinement with restrained and unrestrained TM region.
The initial (bars) and MD refined (circles) structures are shown for the (A) TM region, (B) EL2, and (C) ligand (LIG). Data from simulations with unrestrained (blue) and restrained (orange) TM region using the OPLS protocol are shown.

