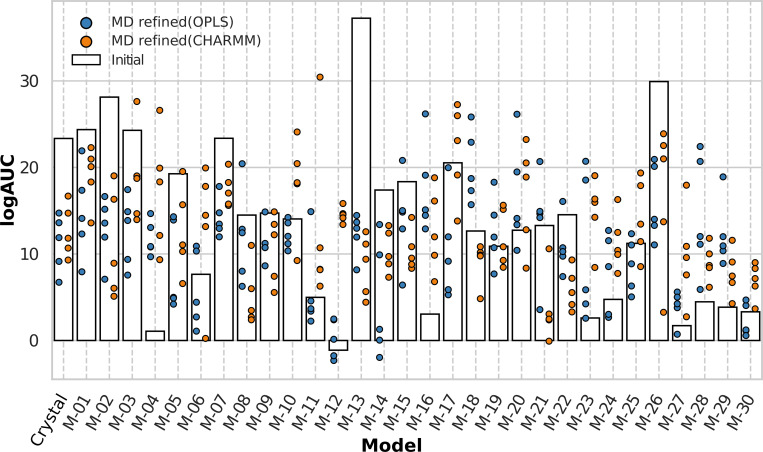
Fig 10. Virtual screening performance of the initial and MD refined structures.
Ligand enrichment was assessed using logAUC values. The results for the crystal structure and initial models are shown as bars. The logAUC values for the five MD refined models and crystal structures are shown as blue and orange circles for the OPLS and CHARMM protocols, respectively.

