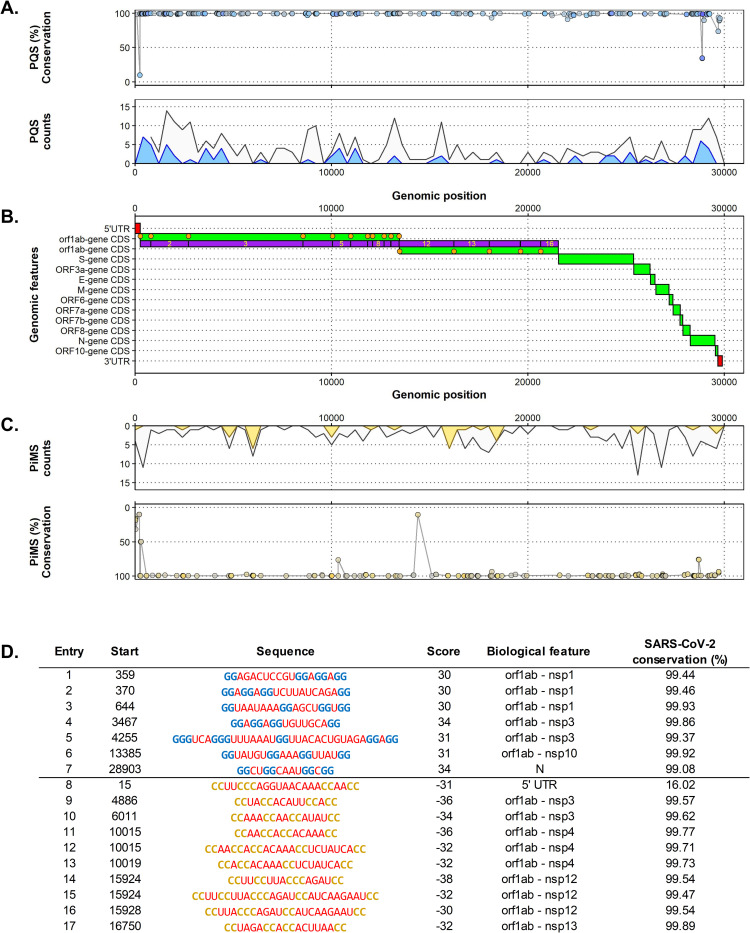
Fig 2.
A. Top. Percentage of conservation of each PQS found along the genome of the SARS-CoV-2. Each point represents one PQS. The PQS score is given by the fill colour of the points, where lower |scores| are greyer, and bluer points have higher |scores|. Bottom. PQS count density plot related to the genome position (counts per 200 nucleotides). Grey coloured density plots are all the results found, whilst blue density plots are the results found with at least a |score| ≥ 20. B. Distribution of the biological features of the SARS-CoV-2 by its genomic position. UTR regions are in red, CDS and genes region are in green, and nps of the orf1ab gene are in purple. Orange dots are mature protein regions of the CDS. C, Top. PiMS count density plot related to the genome position (counts per 200 nucleotides). Grey coloured density plots are all the results found, whilst yellow density plots are the results found with at least a |score| ≥ 20. Bottom. Percentage of conservation of each PiMS found along the genome of the SARS-CoV-2. Each point represents one PiMS. The PiMS score is given by the fill colour of the points, where lower |scores| are greyer, and higher |scores| are more yellow. D. Top scoring PQS (Score ≥ 30, entry 1 to 7) and PiMS (Score ≤ -30, entry 8 to 17) found in the SARS-CoV-2 ordered by their localization in the genome. G-runs are in blue, C-runs are in yellow, loops are in red and bulges within the runs are in green. For each entry, the biological feature column lists the genomic landmark that hosts the potential quadruplex. The percentage of conservation is also given.

