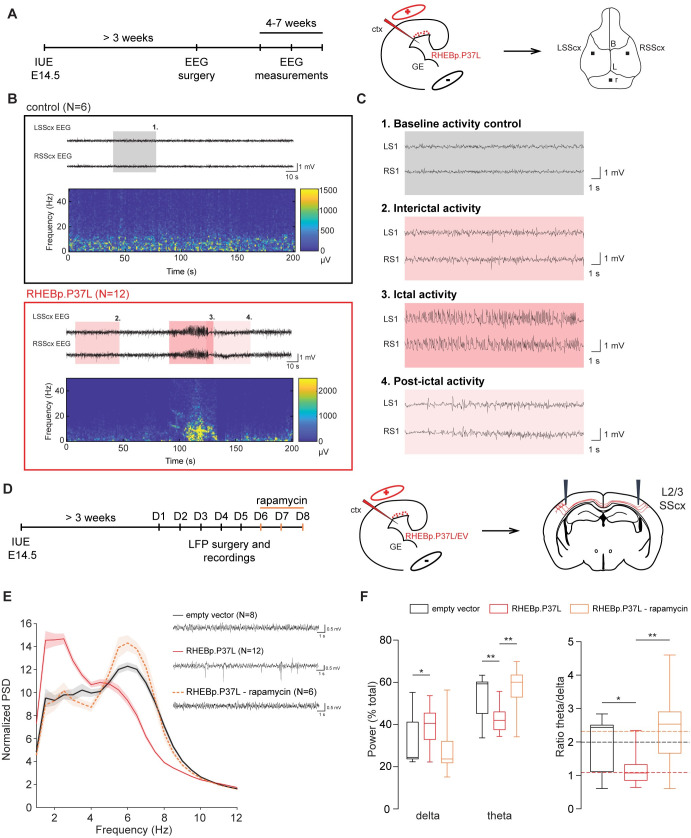
Fig 2. Overexpression of RHEBp.P37L in vivo causes mTORC1-dependent spontaneous generalized tonic–clonic seizures and abnormal neuronal network activity.
(A) Timeline and experimental design indicating the cortical area targeted with the IUE and position of the electrodes placed during the EEG surgery. (B) Example EEG traces and spectrogram of 5-week-old control mouse (N = 6, nontargeted mice from the same litters as the RHEBp.P37L mice) and RHEBp.P37L mouse (N = 12); see also S2A–S2C Fig; colored boxes are zoomed in panel (C). (C) Highlighted EEG traces showing: box 1, the baseline activity of a control mouse; box 2, the interictal activity; box 3, the ictal (seizure) activity; and box 4, the post-ictal phase of a RHEBp.P37L targeted mouse. (D) Timeline and experimental design indicating the cortical area targeted with the IUE, the position of the electrodes for the LFP recordings, and the IP rapamycin injections. (E) Example LFP traces for each group condition and normalized PSD averaged bilaterally over the overall consecutive days of recording (for the PSD until 50 Hz, see S2D Fig); N indicates number of mice analyzed for each group; data are represented as mean (thick line) ± SEM (shading area). (F) Calculation of the delta (2–4 Hz) and theta (4–8 Hz) frequency bands over the total power of the PSD presented in (E), and relative ratio theta/delta (see also S2E Fig); box plots represent minimum and maximum values with median, dashed lines represent the mean values for each group; for statistics, see S2 Table; the data underlying this figure can be found in S2 Data. *p < 0.05, **p < 0.01, ***p < 0.001. B, bregma; ctx, cortex; EEG, electroencephalography; EV, empty vector; GE, ganglion eminence; IP, intraperitoneal; IUE, in utero electroporation; L, lambda; L2/3, layer 2/3; LFP, local field potential; LSScx, left SScx; PSD, power spectrum density; r, reference electrode; RSScx, right SScx; SScx, somatosensory cortex.

