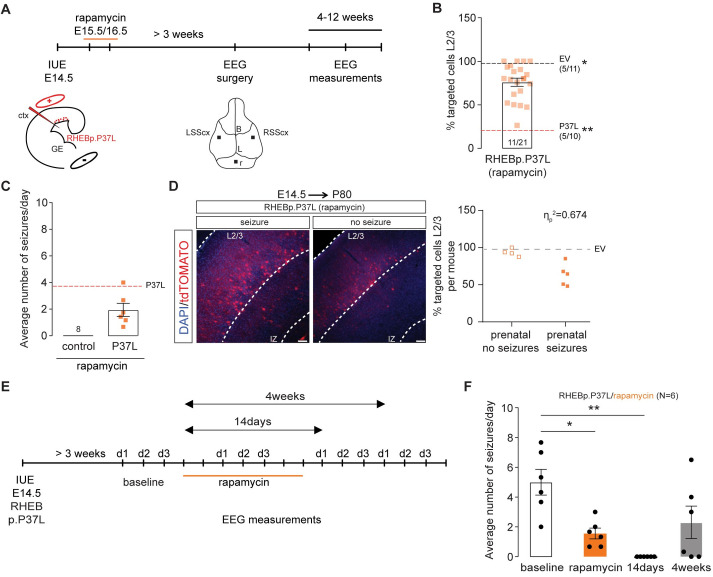
Fig 3. Rapamycin administration prevents the formation of a heterotopic nodule and stops the occurrence of seizures.
(A) Schematic representation of the timeline of the IUE, SC rapamycin injections, and EEG surgery and measurements. (B) Quantification of the percentage of tdTomato+ cells that managed to migrate out to L2/3 in mice prenatally exposed to rapamycin; data are presented as mean ± SEM, single data points represent the values of each picture analyzed and dashed lines indicate the mean value of cells reaching L2/3 in empty vector control mice (black line) and in RHEBp.P37L mice (red line); numbers in the graph indicate number of mice (N = 11, N = 5) and number of pictures analyzed (n = 21, n = 11, n = 10); (% targeted cells in L2/3: H(2) = 25.97, p < 0.0001, Kruskal–Wallis test; EV vs RHEBp.P37L-prenatal rapamycin, p = 0.05; RHEBp.P37L vs RHEBp.P37L-prenatal rapamycin, p = 0.002, RHEBp.P37L vs EV, p < 0.0001, Dunn’s multiple comparisons test; *p<0.05, **p<0.01. (C) Average number of seizures per day of each targeted mouse prenatally treated with rapamycin and showing spontaneous seizures measured with EEG between 4 and 12 weeks of age (N = 6); control mice are nontargeted mice from the same litters as the RHEBp.P37L mice prenatally exposed to rapamycin (N = 8); data are presented as mean ± SEM, the dashed line indicates the average number of seizures of RHEBp.P37L mice not treated with rapamycin (Mann–Whitney U = 17.5, p = 0.09, two-tailed Mann–Whitney test). (D) Representative images of RHEBp.P37L mice prenatally exposed to rapamycin that showed or did not show seizures; the quantification graphs shows the degree of association between the migration phenotype shown in panel B and here presented as % of targeted cells in L2/3(dependent scale variable) for each mouse and the absence or presence of seizures (independent nominal variable) in RHEBp.P37L mice (N = 4 and N = 5, respectively, with the exclusion of the mice that showed heterotopia); the dashed line represents the mean value of the empty vector control group already shown in B, as comparison; ηp = 0.821, ηp2 = 0.674, Eta measure of association, with values of ηp close to one indicating strong association. (E) Schematic representation of the timeline of the IUE, systemic rapamycin injections, and EEG measurements performed for 3 consecutive days over different sessions over time. (F) Average number of seizures per day of each mouse treated with rapamycin (N = 6) measured before treatment (baseline), during and after rapamycin injections; data are presented as mean ± SEM (rapamycin effect over time: F(2.04, 10.19) = 9.1, p = 0.005, RM one-way ANOVA; baseline vs rapamycin: p = 0.03; baseline vs 14 days: p = 0.005; baseline vs 4 weeks: p = 0.17; Dunnett’s multiple comparisons test; the data underlying this figure can be found in S3 Data. *p < 0.05, **p < 0.01. Scale bars: 100 μm. B, bregma; ctx, cortex; EEG, electroencephalography; EV, empty vector; GE, ganglion eminence; IUE, in utero electroporation; L, lambda; L2/3, layer 2/3; LSScx, left SScx; r, reference electrode; RM, repeated measures; RSScx, right SScx; SScx, somatosensory cortex.

