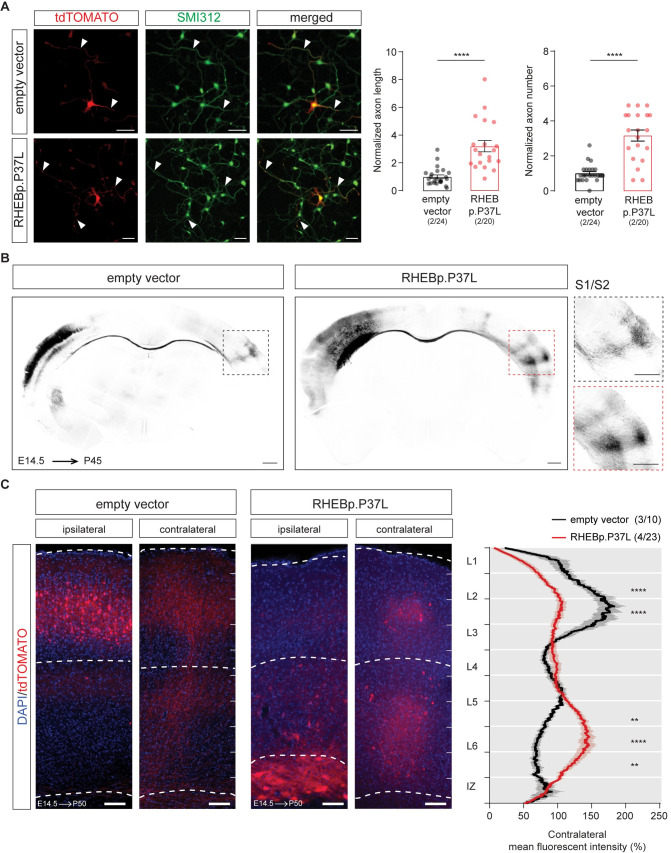
Fig 5. RHEBp.P37L overexpression induces an increase in axon length and branching both in vitro and in vivo.
(A) Representative images of primary hippocampal cultures transfected at DIV1 with either empty vector control or RHEBp.P37L constructs (tdTomato, in red) stained at DIV4 with a pan axonal marker SMI312 (in green); arrowheads indicate the axons; bar graphs represent mean ± SEM and single data points indicate the number of cells analyzed; numbers indicate number of neuronal cultures (N = 2) and total number of cells analyzed (n = 24, n = 20); axonal length: Mann–Whitney U = 32, p < 0.0001, Mann–Whitney test; axonal branches: Mann–Whitney U = 53, p < 0.0001, Mann–Whitney test. (B) Overview coronal sections in grey scale stained with anti-RFP antibody of an empty vector and a RHEBp.P37L mouse brain in utero electroporated on the left S1 and magnification of the axon terminals on the contralateral S1; scale bars: 500 μm. (C) Representative images of ipsilateral and contralateral S1 area of an empty vector and a RHEBp.P37L mouse coronal section (P50) with quantification of the axonal projections across the different layers in the contralateral cortex measured as normalized fluorescent intensity of the tdTomato signal; numbers in the legend indicate number of targeted mice (N = 3, N = 4) and number of contralateral pictures (n = 10, n = 23) analyzed; data are presented as mean (thick line) ± SEM (shading area); interaction group condition/cortical layers: F(9, 279) = 13.96, p < 0.0001, mixed-effects analysis; control vs RHEBp.P37L L2/3 (bin2–3 from the top): p < 0.0001; control vs RHEBp.P37L L5-L6: bin7, p = 0.0074, bin8, p < 0.0001, bin 9, p = 0.002; Bonferroni multiple comparisons test. The data underlying this figure can be found in S5 Data. **p < 0.01, ****p < 0.0001; scale bars: 50 μm (A), 500 μm (B), and 100 μm (C). DIV1, 1 day in vitro; DIV4, day in vitro 4.

