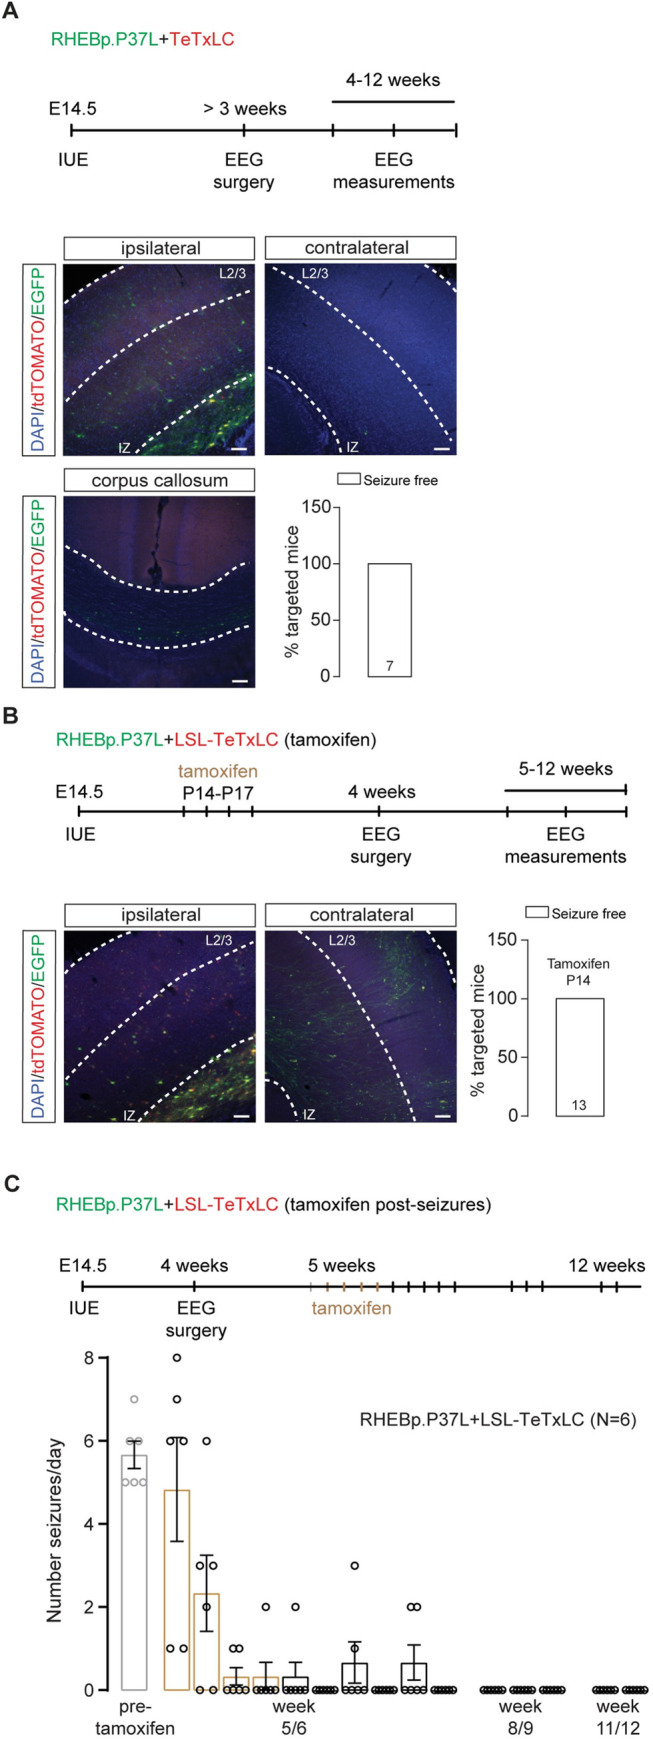
Fig 7. Loss of axonal projections or blocking vesicle release of RHEBp.P37L expressing neurons is sufficient to stop seizures.

(A) Schematic representation of the timeline of the IUE, EEG surgery, and EEG measurements upon expression of a RHEBp.P37L (construct expressing EGFP, in green) and a TeTxLC (construct expressing tdTomato, in red). Example figures of ipsilateral targeted S1, corpus callosum, and contralateral S1 of an in utero electroporated adult mouse at 12 weeks of age. Note the absence of axonal projections on the contralateral side. The bar graph shows percentage of seizure-free targeted mice measured with EEG until 12 weeks of age. Numbers in the bar graph indicate number of mice. (B) Schematic representation of the timeline of the IUE, tamoxifen administration, EEG surgery, and EEG measurements upon expression of a RHEBp.P37L (construct expressing EGFP, in green) and a LSL-TeTxLC (in red). Example figures of ipsilateral targeted area (left) and contralateral cortex of an in utero electroporated adult mouse (12 weeks) injected with tamoxifen starting at P14 for 4 times. The bar graph shows percentage of targeted mice developing seizures upon early tamoxifen injection (P14) and measured with EEG until 12 weeks of age. Numbers in the bar graphs indicate number of mice. (C) Schematic representation of the timeline of the IUE, EEG surgery and measurements, and tamoxifen administration upon expression of a RHEBp.P37L (construct expressing EGFP, in green) and a LSL-TeTxLC (in red). Tamoxifen was administered for 4 consecutive days after seizures were first measured for full 24 hours, and mice were continuously monitored with EEG for 10 consecutive days. Mice were measured again at week 8/9 and finally at week 11/12 before sacrifice. Data are presented as mean ± SEM, and each data point represents a single mouse (tamoxifen effect over time: F(2.8, 14.20) = 17.9, p < 0.0001, RM one-way ANOVA). The data underlying this figure can be found in S7 Data. Scale bars: 100 μm. EEG, electroencephalography; IUE, in utero electroporation; IZ, intermediate zone; L2/3, layer 2/3; LSL-TeTxLC, LSL-tetanus toxin light chain; TeTxLC, tetanus toxin light chain.
