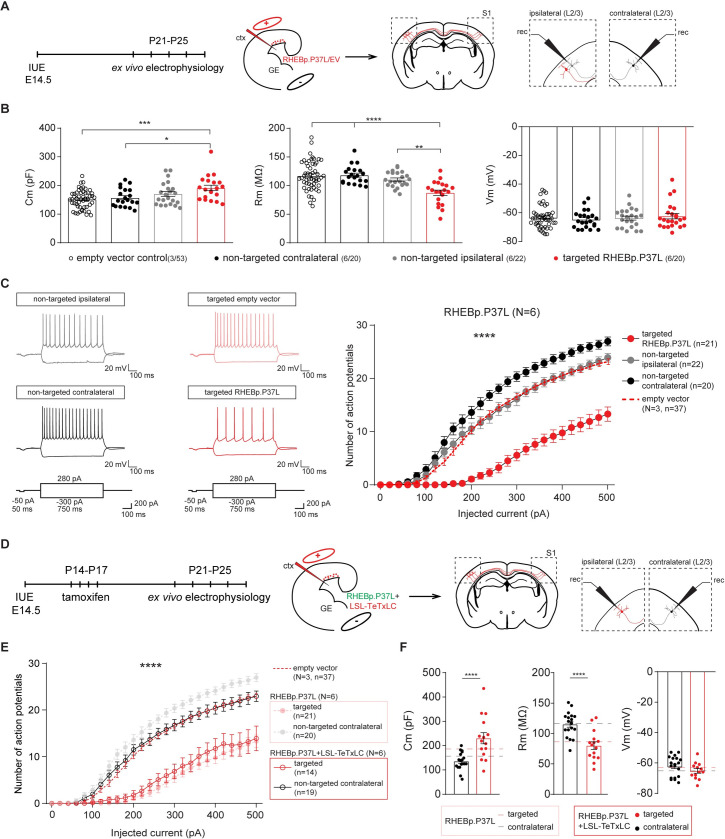
Fig 8. Neurons in the contralateral homotopic cortical area in RHEBp.P37L mice show increased excitability that can be reversed by blocking vesicles release.
(A) Schematic representation of the timeline and experimental conditions of the IUE and ex vivo whole-cell patch clamp recordings showing the targeted cells patched in the targeted S1, L2/3, and nontargeted L2/3 cells in the ipsilateral and contralateral sides. (B) Analysis of the passive membrane properties (Cm, Rm, and Vm) of pyramidal cells in L2/3 (targeted and nontargeted) of control EV mice and targeted and nontargeted pyramidal cells in L2/3 of RHEBp.P37L mice; numbers in the legend indicate number of targeted mice (N = 3, N = 6) and number of cells (n = 37, n = 20, n = 22, n = 21) analyzed; data are presented as mean ± SEM and single data points indicate the values of each cell; for statistics, see S4 Table. (C) Example traces and number of action potentials in response to increasing depolarizing currents; number of mice and cells is as indicated in (B); data are presented as mean ± SEM and the red dashed line represents the pooled mean value ± SEM of targeted and nontargeted cells in empty vector control mice (N = 3) shown separately in S5A Fig, for comparison; for statistics, see S4 Table. (D) Schematic representation of the timeline and experimental conditions IUE, tamoxifen injections, and ex vivo whole-cell patch clamp recordings in L2/3 of ipsilateral and contralateral S1 cortex. (E) Number of action potentials in response to increasing depolarizing currents of cells expressing both RHEBp.P37L and LSL-TeTxLC in L2/3 ipsilateral S1 and nontargeted cells in L2/3 contralateral S1; data are presented as mean ± SEM and dashed lines represent the mean values ± SEM of the pooled control cells from EV mice shown in S5A Fig and of the RHEBp.P37L mice from Fig 8C, for comparison; N = number of mice, n = number of cells analyzed; for statistics see S5 Table. (F) Analysis of passive membrane properties (Cm, Rm, and Vm) of pyramidal cells in L2/3 of mice targeted with RHEBp.P37L and LSL-TeTxLC in ipsilateral S1 and nontargeted cells on the contralateral side; data are presented as mean ± SEM and the dashed lines indicate the mean values of Cm, Rm, and Vm of RHEBp.P37L targeted cells in L2/3 and contralateral cells shown in Fig 8B, for comparison; for statistics see S5 Table. The data underlying this figure can be found in S8 Data. *p < 0.05, **p < 0.01, ***p < 0.001, ****p < 0.0001. Cm, capacitance; ctx, cortex; EV, empty vector; GE, ganglion eminence; IUE, in utero electroporation; L2/3, layer 2/3; LSL-TeTxLC, LSL-tetanus toxin light chain; Rm, membrane resistance; Vm, resting membrane potential.

