FIGURE 3.
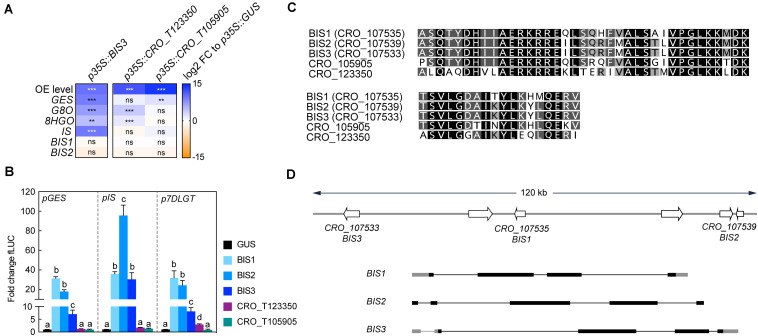
BIS3 up-regulates iridoid pathway genes. (A) Overexpression of BIS3 leads to increased expression levels of iridoid pathway genes similar to those previously observed for BIS1 and 2, whereas overexpression of the other clade IVa TFs CRO_T123350 and CRO_T105905 leads to comparably much lower increases. BIS1 and 2 themselves are not up-regulated by BIS3, suggesting that the iridoid pathway up-regulation is directly caused by BIS3 and that there is no cross up-regulation between the three BIS TFs. Asterisks indicate statistically significant differences in expression (**P < 0.01, ***P < 0.01) as calculated by Student’s t-test for each gene compared to GUS control (not included in this graph). (B) N. tabacum protoplasts were co-transfected with constructs containing the firefly luciferase gene (fLUC) expressed under control of the indicated promoter fragments and constructs for overexpression of bHLHs as indicated or GUS as a control. The y-axis shows fold change in normalized fLUC activity relative to the control transfection with GUS, set at 1. The error bars depict SEM of four biological replicates. For each promoter, columns labeled with different letters represent statistically significant differences (P < 0.05, ANOVA with Tukey’s correction for multiple comparisons). BIS1-3 redundantly highly transactivate iridoid pathway promoters whereas CRO_T123350 and CRO_T105905 have no effect. (C) A MUSCLE alignment of the bHLH domain protein sequences reveals a high level of sequence identity between the five clade IVa bHLHs. However, BIS1, 2 and 3 show a slightly higher level of identity than CRO_T123350 and CRO_T105905 potentially explaining the differential level of up-regulation of iridoid pathway genes. Sites that are identical in all five sequences are colored in black; sites identical in four out of five sequences are colored in dark gray and sites identical in 3 out of 5 sequences are colored in light gray. (D) The latest version of the C. roseus genome revealed that the previously published BIS1 and 2, and BIS3 identified in this study, are all located in close proximity and have similarly organized gene structures suggesting that they probably arose from recent gene duplications. Exons are depicted as bars with untranslated regions (UTRs) in gray and CDS’ in black. Introns are depicted as black lines.

