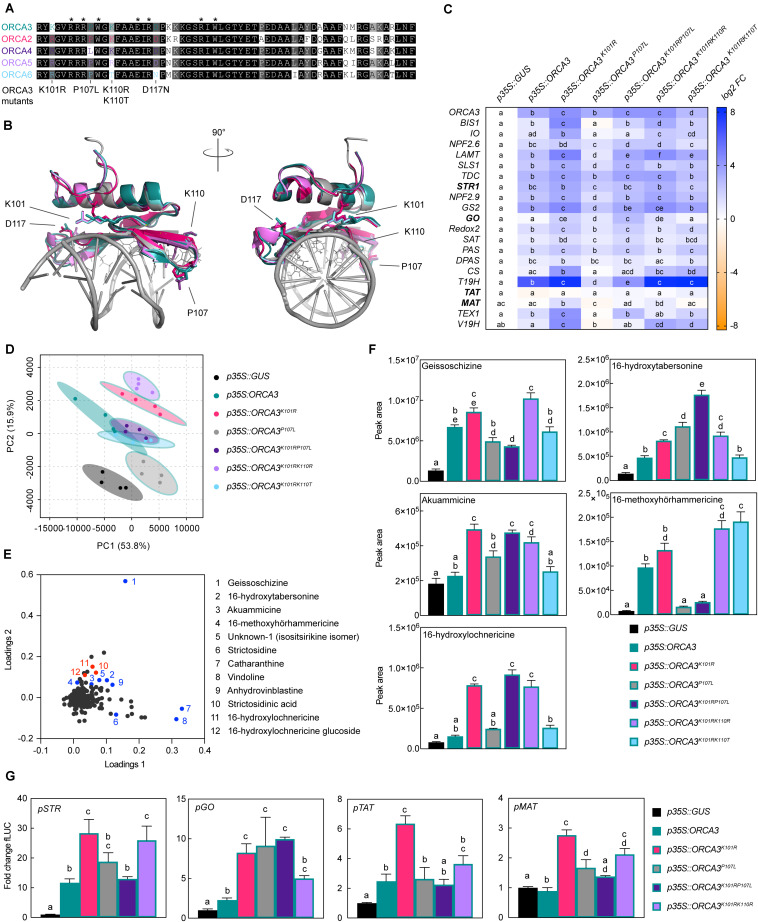
FIGURE 5.
Specific amino acid residues (AARs) in the DNA-binding domain (DBD) of ORCA TFs influence target gene specificity. (A) Alignment of the DBDs of ORCAs. AARs labeled with an asterisk were identified previously as directly interacting with the DNA based on the solved crystal structure of the Arabidopsis AP2/ERF member AtERF1 DBD (Allen et al., 1998; Shoji et al., 2013). ORCA3 was used as a template to exchange AARs so that they would correspond to AARs in other ORCA TFs. The respective mutated AARs are indicated below the alignment. (B) Homology models of ORCA DBDs. The models [made by Phyre2 “intensive mode” (Kelley et al., 2015); colored as in panel (A)] are overlaid with the AtERF1 structure bound to DNA (PDB 1GCC) colored in gray. AARs identified as directly interacting with the DNA [asterisks in panel (A)] are shown as lines of AtERF1. AARs differing in the ORCA DBDs and selected for site-directed mutagenesis are shown as sticks for all ORCA models, while the AAR numbering refers to ORCA3. The models suggest that the differing AARs are unlikely to interact directly with the DNA, but are in close proximity to the DNA and might thereby modulate DNA binding affinity. (C) Overexpression of ORCA3 mutants in C. roseus flower petals and expression level of selected MIA target genes as measured by qPCR. Two AAR changes, K101R and P107L, seem to significantly modulate the MIA target gene profile. While K101R appears to increase the level of up-regulation, up-regulation is greatly reduced and in some cases nearly abolished when overexpressing the ORCA3P107L mutant. The double mutant ORCA3K101RP107L, corresponding to the native ORCA4 sequence, recovers some activation potential, and reaches similar levels than observed upon overexpression of ORCA4 (Figure 4D). This suggests that the combination of these AARs may account for the differences between ORCA3 and 4. For each pathway gene, cells labeled with different letters represent statistically significant differences (P < 0.05, ANOVA with Tukey’s correction for multiple comparisons). Results from overexpression of all ORCA3 single AAR mutants (including ORCA3D117N) can be found in Supplementary Figure 6. (D) PCA of metabolite profiling data. (E) Loading plot indicating that sample separation shown in the PCA plot is largely due to changes in MIA metabolite levels. Selected known MIAs are labeled in blue; MIAs identified in this study are labeled in red. (F) Levels of selected MIA metabolites expressed in average total ion current (TIC). The levels of all measured MIA metabolites can be found in the supporting information (Supplementary Figure 8; Supplementary Table 7). Columns labeled with different letters represent statistically significant differences (P < 0.05, ANOVA with Tukey’s correction for multiple comparisons). Error bars are standard error of the mean (SEM) of four biological replicates. (G) Transactivation assays of pSTR, pGO, pTAT, and pMAT performed in tobacco protoplasts. Columns labeled with different letters represent statistically significant differences (P < 0.05, ANOVA with Tukey’s correction for multiple comparisons). Error bars are standard error of the mean (SEM) of four biological replicates.

