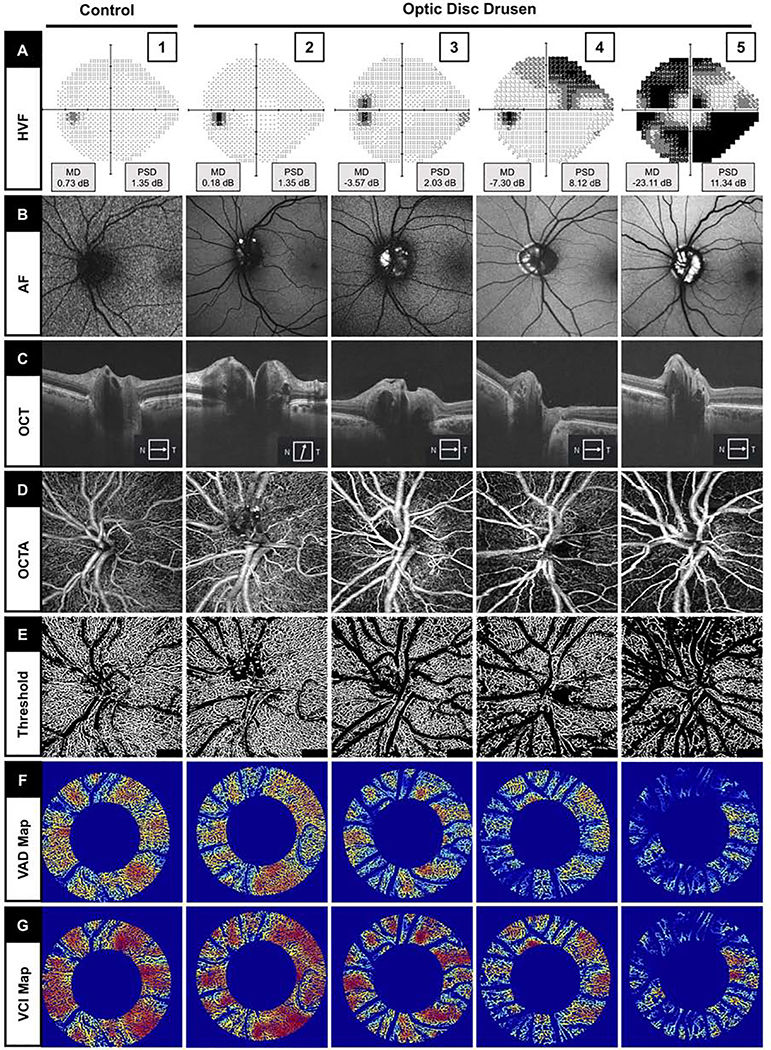
FIGURE 1.
Representative static perimetry and superficial peripapillary en face microvascular images of control (Column 1) and optic disc drusen (ODD) eyes with increasing severity of visual field loss (Column 2–5 from left to right). (A) Static perimetry using Humphrey visual field (HVF) with mean deviation (MD) and pattern standard deviation (PSD) measurements. (B) Fundus autofluorescence (AF) imaging showing ODD as hyperfluorescent areas. (C) OCT raster scan through the optic disc showing ODD as a signal-poor ovoid core with hyperreflective margin. (D) En face OCTA slab. (E) Threshold OCTA images of (D) after removing the large vessels. (F) Vessel area density (VAD) map with binary vessels after removing the large vessels. (G) Vessel complexity index (VCI) map after removing the large vessels.

