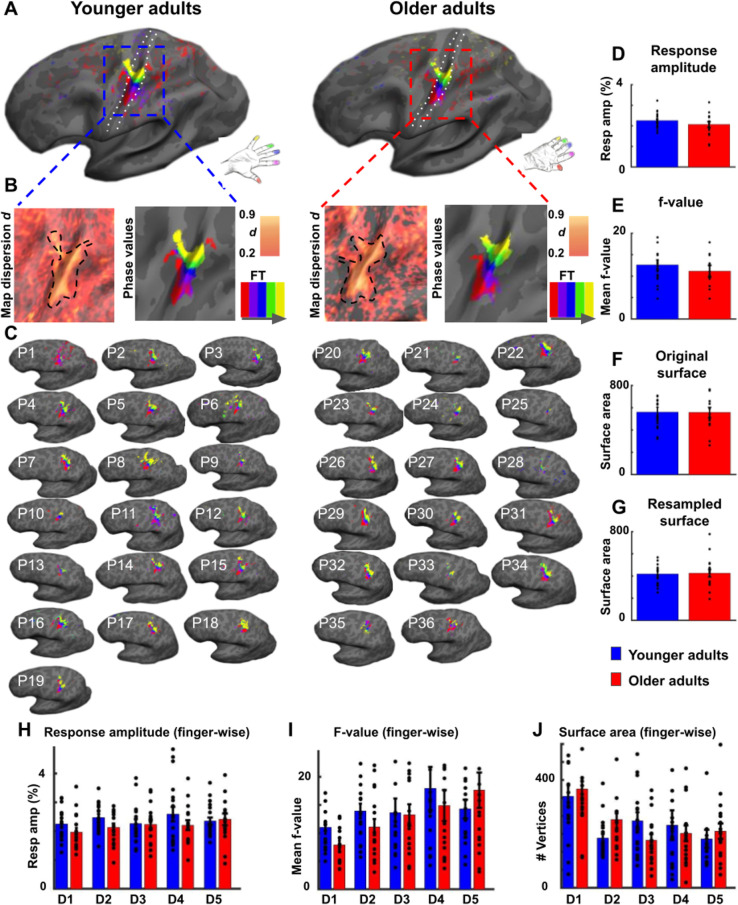
Figure 2. Surface area and % signal change of area 3b topographic maps do not differ significantly between younger and older adults.
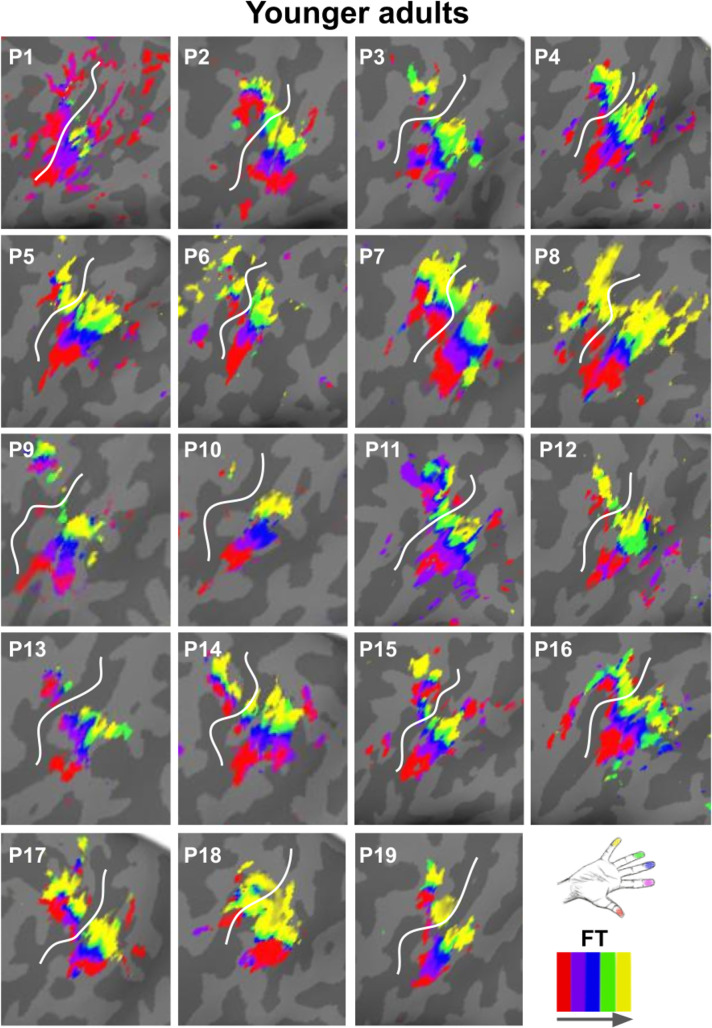
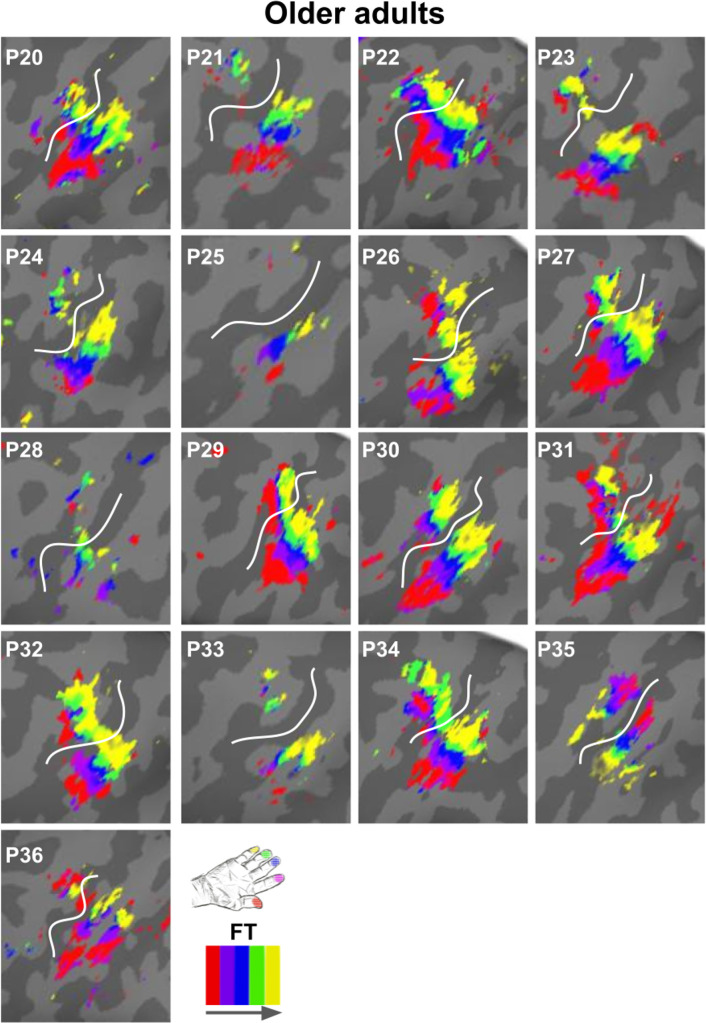
(A) Significant topographic finger maps of younger and older adults averaged separately over the group of younger adults and over the group of older adults. Data are visualized on average surfaces of the current set of subjects (younger/older).White dotted lines show the schematic outline of area 3b. (B) Map dispersion d and Fourier transformed (FT, gray arrow indicates stimulation order) data of significant topographic group maps of younger and older adults (d young: 0.68 ± 0.002, d old: 0.72 ± 0.002). Lower d indicates less stable topographic arrangements over the group. Black dotted lines indicate the area of the significant topographic map. (C) Significant topographic FT maps of each single participant (P1-P36). See Figure 2—figure supplement 1 and Figure 2—figure supplement 3 for zoomed-in views of individual maps. (D,H) Response amplitudes (in %) of topographic maps (D) and of individual fingers (H) in area 3b compared between younger and older adults (mean ± SE and individual data). (E,I) f-values of topographic maps (E) and of individual fingers (I) in area 3b compared between younger and older adults (mean ± SE and individual data). (F,G,J) Surface area of topographic maps of area 3b of younger and older adults; values extracted from original (F) and resampled (G) surfaces of the topographic maps, and of individual fingers (J) (mean ± SE and individual data). Shown are data of n = 19 younger adults and n = 17 older adults. See Figure 2—figure supplement 3 for significant differences in response amplitudes between younger and older adults during fixed amplitude stimulation.
Figure 2—figure supplement 1. Zoomed-in topographic maps of younger adults.
Figure 2—figure supplement 2. Zoomed-in topographic maps of older adults.
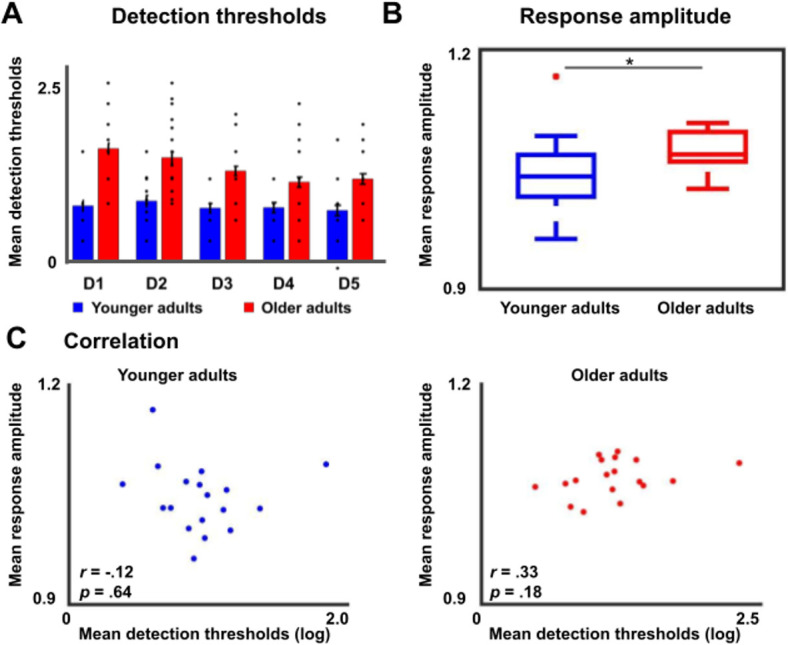
Figure 2—figure supplement 3. Tactile detection thresholds and response amplitudes during fixed amplitude stimulation in younger and older adults.


