
Figure 3. Reduced cortical distances between representations of D2 and D3 in older adults.
(A, B) Cortical distances between digit representations in younger and older adults estimated as total (Euclidean) distance (A) and as surface-based (geodesic) distance (B) (mean ± SEM and individual data) (C) Schematic visualization of cortical distance measures. (D) Effect sizes (Hedge’s g and 95% confidence intervals) for Euclidean and geodesic distances. (E) Spatial alignment of younger adults’ (top) and older adults (bottom) digit representations in area 3b displayed in the MNI coordinate system. Line represents linear fit, arrows highlight significant differences in cortical distance between younger and older adults. Shown are data of n = 19 younger adults and n = 17 older adults. See Figure 3—figure supplement 1 for individual plots, and Figure 3—figure supplement 2 for cortical distances using center estimates.
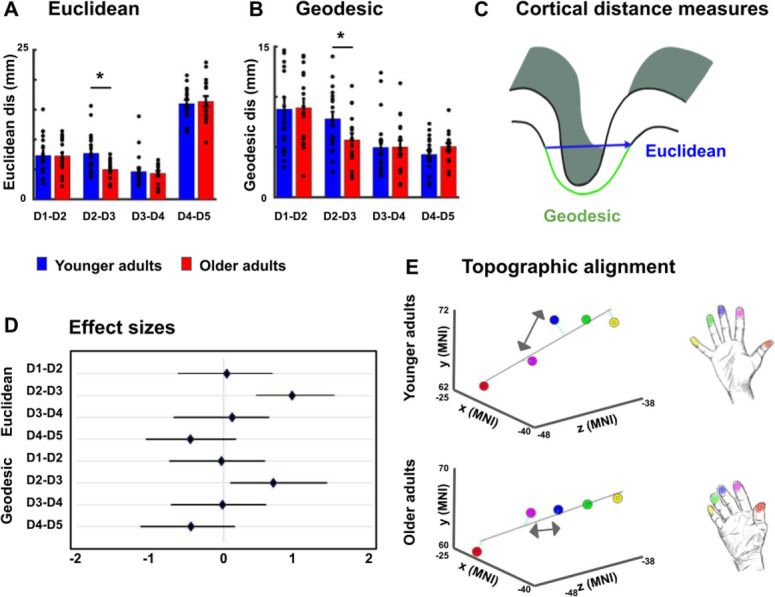
Figure 3—figure supplement 1. Spatial alignment of individual maps.

Figure 3—figure supplement 2. Cortical distances based on center estimates.
