. 2021 May 18;10:e60090. doi: 10.7554/eLife.60090

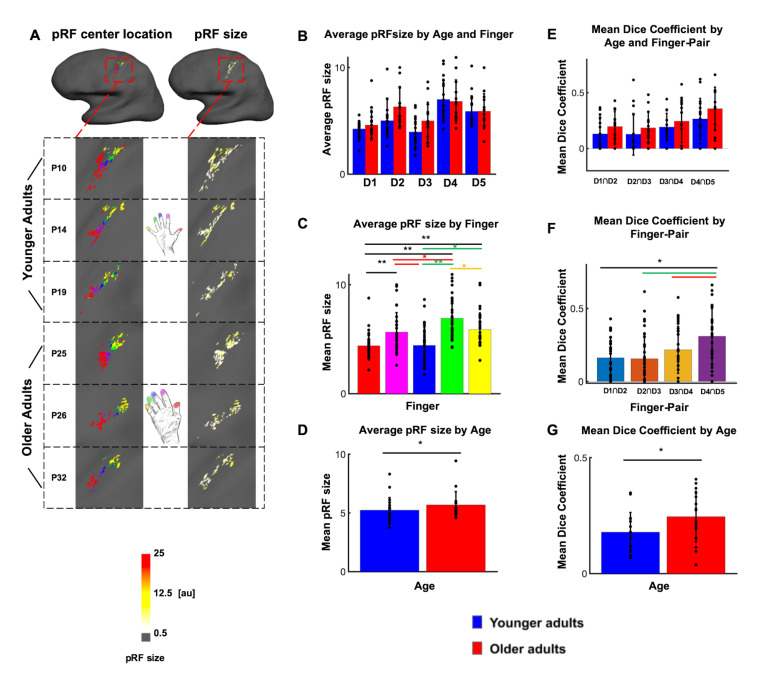
Figure 4. Larger population receptive field (pRF) sizes in older adults compared to younger adults.

(A) pRF centre locations (which encode each individual finger, left column) and pRF sizes (which encode the estimated pRF size of each finger representation, right column) shown for six individual participants (randomly chosen, participant numbers same as in Figure 2, see Figure 4—figure supplement 1 for all individual data and a comparison to the Fourier transformed maps shown in Figure 2). (B) Average pRF sizes for each finger for younger and older adults (mean ± SEM and individual data). (C) Visualization of significant main effect of finger for pRF sizes (mean ± SEM and individual data). (D) Visualization of significant main effect of age for pRF sizes (mean ± SEM and individual data). Correlations between pRF sizes and cortical distances, motor behavior and tactile discrimination performance are shown in Figure 4—figure supplement 2. Shown are data of n = 19 younger adults and n = 17 older adults. (E) Mean dice coefficients for each finger pair for younger and older adults (mean ± SEM and individual data). (F) Visualization of significant main effect of finger-pairs for dice coefficient (mean ± SEM and individual data). (G) Visualization of significant main effect of age for dice coefficient (mean ± SEM and individual data).

Figure 4.

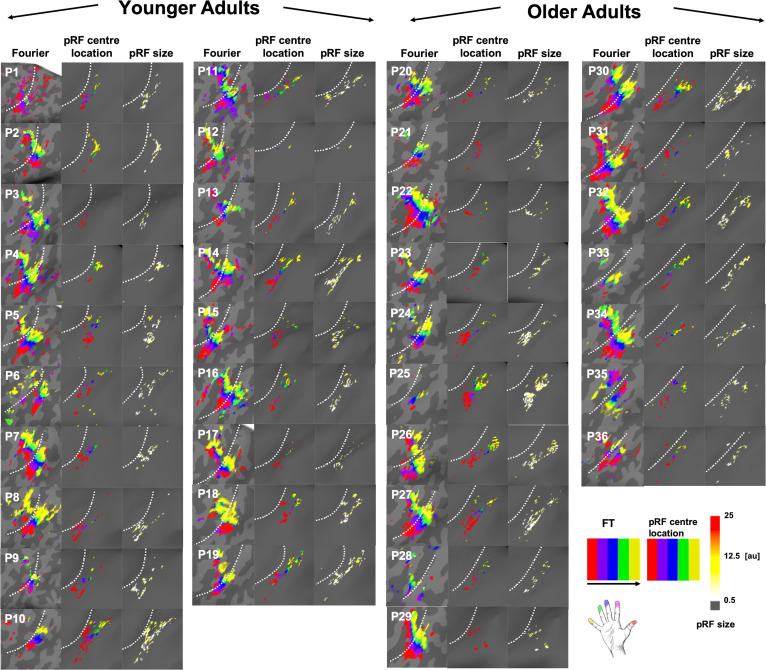
Figure 4—figure supplement 1. Comparison between Fourier-based topographic maps and pRF-based topographic maps for each younger and each older adult.

Figure 4—figure supplement 1.

Fourier-based topographic maps (left column within each column group) were created with Fourier transformed (FT) data sensitive to frequency and phase. The black arrow indicates stimulation order. pRF-based topographic maps (middle column within each column group) and pRF sizes (right column within each column group) were created using Bayesian pRF modeling. Note that for both topographic maps, the same color scales were chosen for an easy visual comparison (red, purple, blue, green and yellow for D1-D5), even though the analyses pipelines were different. The white-dash line indicates the border between BA 3a and 3b. The color scale for pRF size indicates pRF size for each participant falls within the range between 0.5 to 25 (arbitrary units = au).
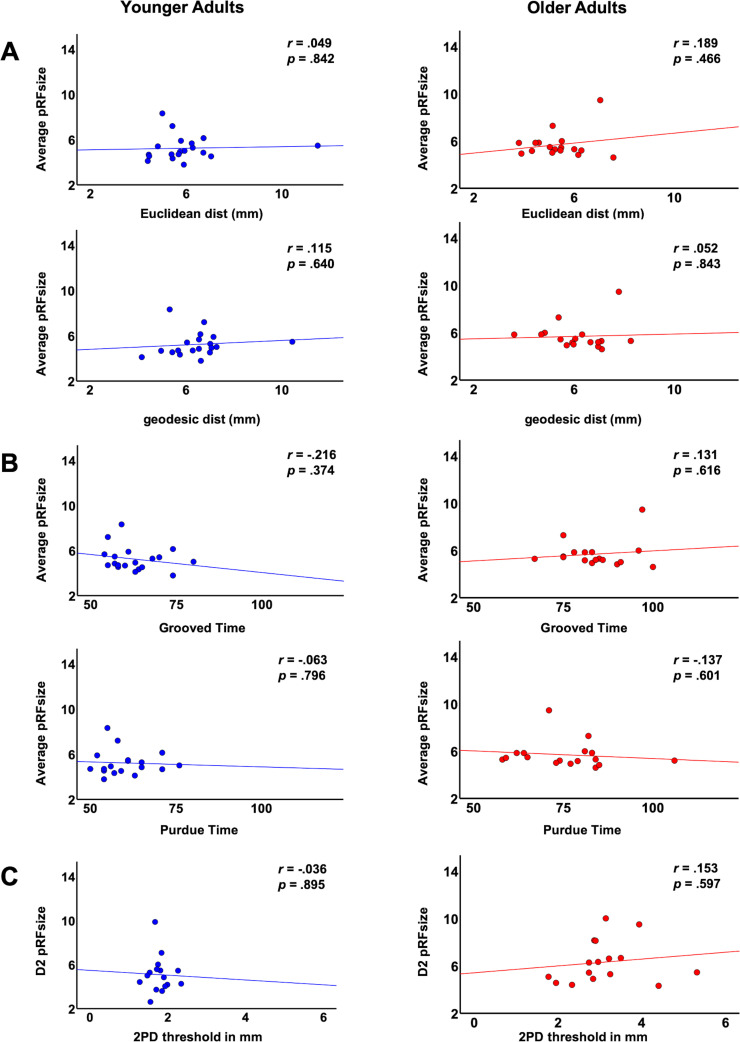
Figure 4—figure supplement 2. Correlations between average pRF size and functional and behavioral variables.

Figure 4—figure supplement 2.

Shown are correlations within the group of younger adults and within the group of older adults between average pRF sizes across fingers and the following variables: (A) cortical distances: Euclidean distance and geodesic distance, (B) behavioral measures: time to complete the Purdue Pegboard Test (in s) and time to complete the Grooved Pegboard Test (in s), and correlation between pRF size of D2 and (C) two-point discrimination (2PD) thresholds (given in mm).
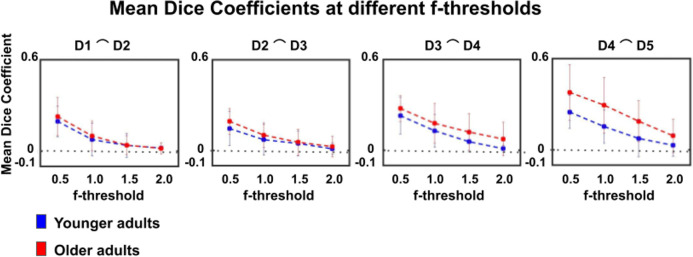
Figure 4—figure supplement 3. Dice coefficients at different statistical thresholds in younger and older adults.

Figure 4—figure supplement 3.

Visualization of dice coefficient (mean ± SEM) at different f-thresholds (f > 0.5, f > 1.0, f > 1.5, f > 2.0) within the group of younger and older adults.