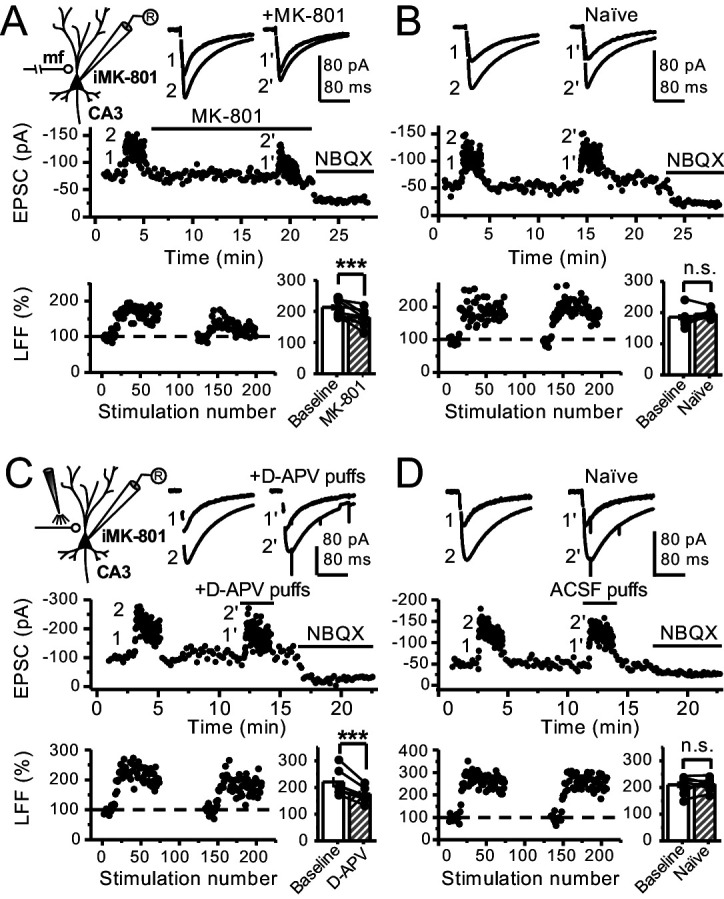
Figure 3. Reduced facilitation by NMDAR antagonism is independent of the GC somatodendritic compartment.
(A) KAR-EPSCs were recorded at Vh = −70 mV in the presence of 15 µM LY303070 and 100 µM picrotoxin. In addition, NMDAR-mediated transmission was blocked intracellularly by loading MK-801 (2 mM) in the patch-pipette. LFF of KAR-EPSCs was assessed as in Figure 1G but with transected mf axons (see Materials and methods). Bath application of MK-801 (50 µM) significantly reduced LFF (baseline 213 ± 9%, MK-801 181 ± 10%, n = 8 cells, seven animals; baseline vs MK-801, p=0.002, paired t-test). In all panels of this figure: recording arrangement (inset), representative traces (top), representative experiment (middle), normalized LFF and summary plot (bottom). (B) Stable LFF in transected, naïve slices (baseline 186 ± 10%, naïve 196 ± 5%, n = 8 cells, seven animals; baseline vs naïve, p=0.278, paired t-test). (C) LFF was induced before and during puff application of D-APV (2 mM) in stratum lucidum. This manipulation significantly reduced facilitation (baseline 220 ± 19%, D-APV puff 176 ± 11%, n = 7 cells, seven animals; baseline vs D-APV puff, p=0.003, paired t-test). (D) Stable LFF in acute slices during puff application of ACSF (baseline 210% ± 12, naïve 213% ± 9, n = 7 cells, seven animals; baseline vs naïve, p=0.778, paired t-test). NBQX (10 µM) was applied at the end of all recordings to confirm mf KAR transmission. Data are presented as mean ± s.e.m. ***p<0.005.


