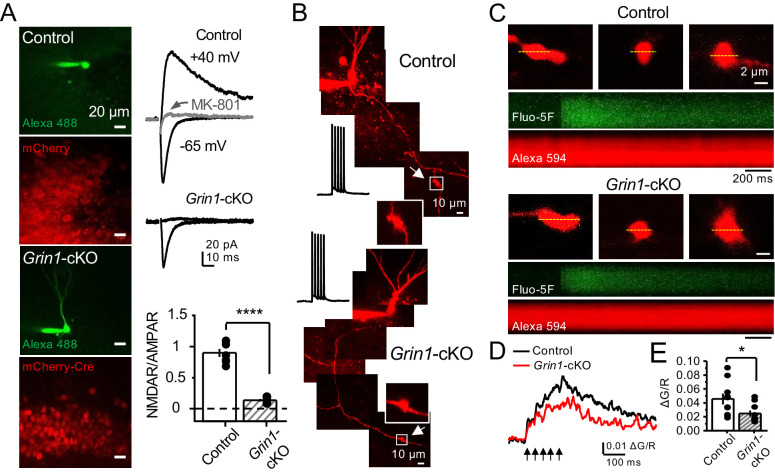
Figure 5. preNMDARs contribute to presynaptic Ca2+ rise.
(A) Representative images showing GCs patch-loaded with Alexa 488 (35 µM) to confirm expression of mCherry (bottom). Representative AMPAR-EPSCs recorded from control (top) or Grin1-cKO (middle) GCs. Synaptic responses were elicited by activating medial perforant-path inputs. AMPAR-ESPCs were recorded at Vh = −65 mV in the presence of 100 µM picrotoxin, NMDAR-EPSCs were isolated with 10 µM NBQX and recorded at +40 mV. MK-801 (20 µM) was applied at the end of each experiment. Summary plot (bottom) demonstrating that GluN1 deletion from GCs virtually abolished NMDAR-mediated transmission indicated by a strong reduction of NMDAR/AMPAR in Grin1-cKO granule cells as compared to controls (control 0.90 ± 0.17, n = 7 cells, six animals; Grin1-cKO 0.13 ± 0.05, n = 6 cells, six animals; control vs Grin1-cKO, p=3.81×10⁻⁷, unpaired t-test). (B) Representative control and Grin1-cKO GCs patch-loaded with Fluo-5F (200 µM) and Alexa 594 (35 µM). Arrows indicate the identification of a mf giant bouton, magnified images in white box. (C) Three representative mf boutons (top) and line scan image of calcium transients (CaTs) elicited by five action potentials at 25 Hz (middle, Fluo-5F) and morphological dye (bottom, Alexa 594), in Control and Grin1-cKO animals. Dotted line (yellow) indicates line scan location. Red Channel, Alexa 594; Green Channel, Fluo-5F. (D, E) Peak analysis of the fifth pulse ΔG/R revealed a significant reduction in Ca2+ rise of Grin1-cKO animals as compared to Control (control 0.046 ± 0.01, n = 10 boutons, three line scans per bouton, eight animals; Grin1-cKO 0.025 ± 0.004, n = 10 boutons, eight animals; control vs Grin1-cKO, U = 0.017, Mann–Whitney test). Arrows indicate mf activation. Data are presented as mean ± s.e.m. *U < 0.05; ****p<0.001.


