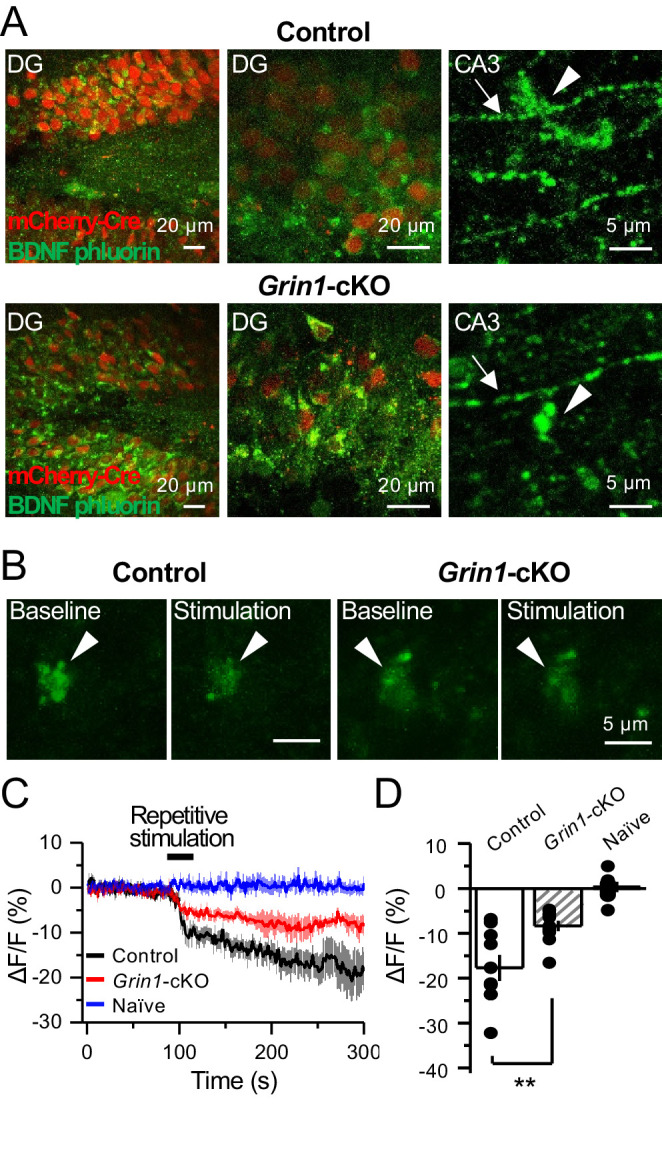
Figure 7. preNMDARs contribute significantly to BDNF release following repetitive activity.
(A) Representative images showing expression of BDNF-pHluorin in the DG and CA3 area (arrows indicate mf axon, arrowheads indicate mf boutons). Control images (top), Grin1-cKO images (bottom). (B) Representative images of BDNF-pHluorin signal intensity at baseline and after repetitive stimulation of mfs (125 pulses, 25 Hz, ×2). Control images (left), Grin1-cKO images (right), arrowhead indicates region of interest. (C) Time course of BDNF-pHluorin signal intensity measured as ΔF/F (%): control (black), Grin1-cKO (red), Naïve (blue). (D) Quantification of BDNF-pHluorin signal in (C) during the last 100 s reveals larger BDNF release in control animals as compared to Grin1-cKO (control −18% ± 3%, n = 9 slices, five animals; Grin1-cKO −8 ± 1%, n = 10 slices, five animals; Grin1-cKO vs control, p=0.00648, unpaired t-test). Data are presented as mean ± s.e.m. **p<0.01.

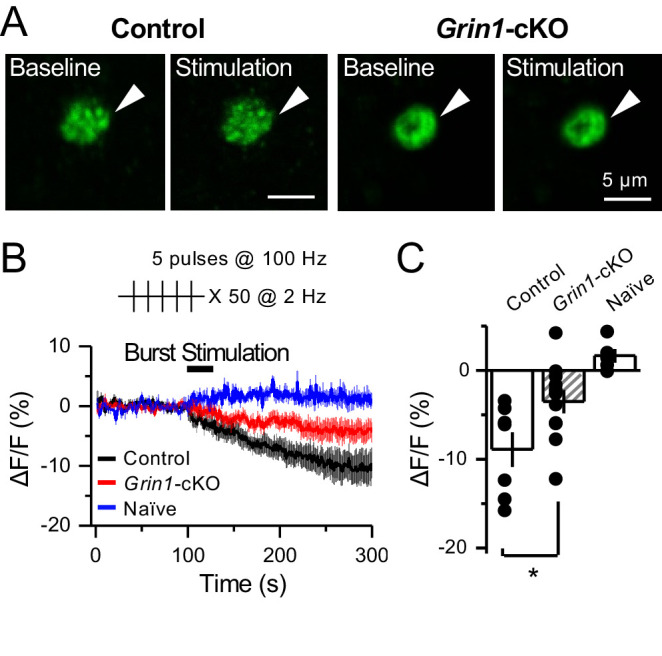
Figure 7—figure supplement 1. preNMDARs contribute significantly to BDNF release following a more physiological pattern of burst stimulation.

