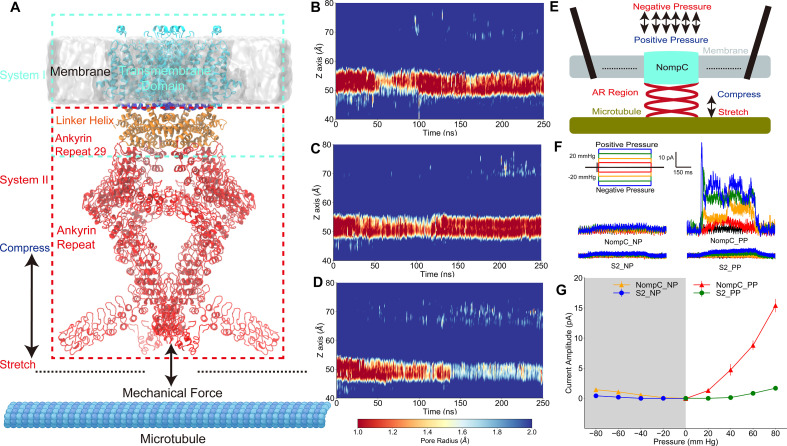
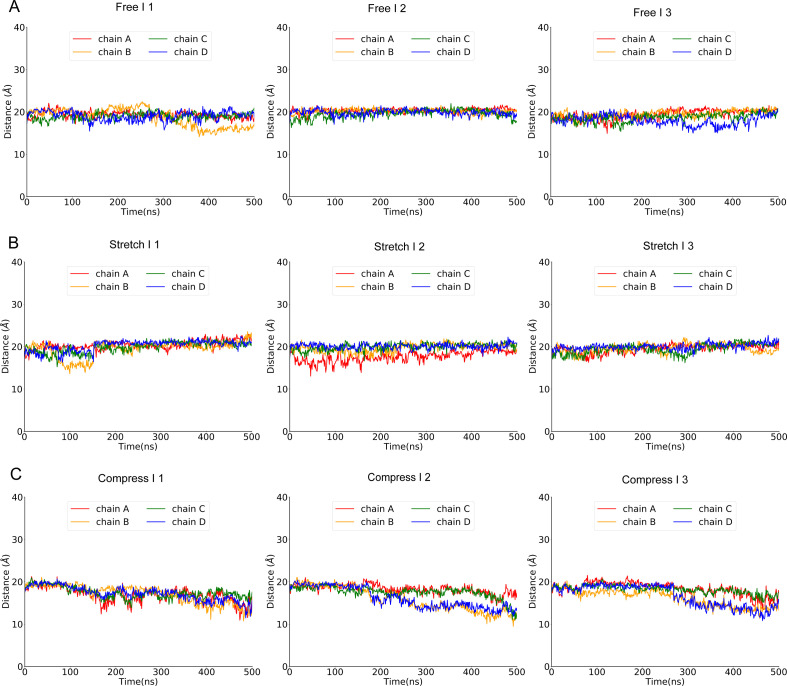
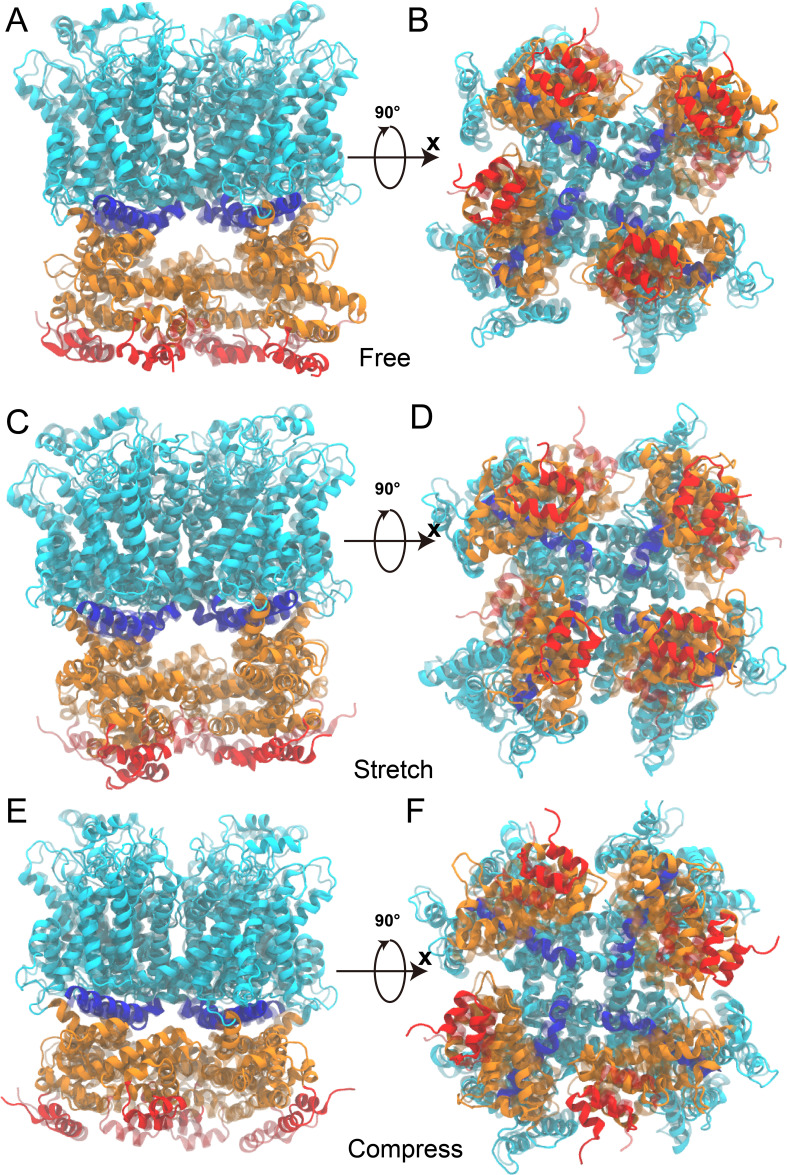
Figure 1. The tethered NompC channel was opened by compression of the intracellular ankyrin repeat domain.
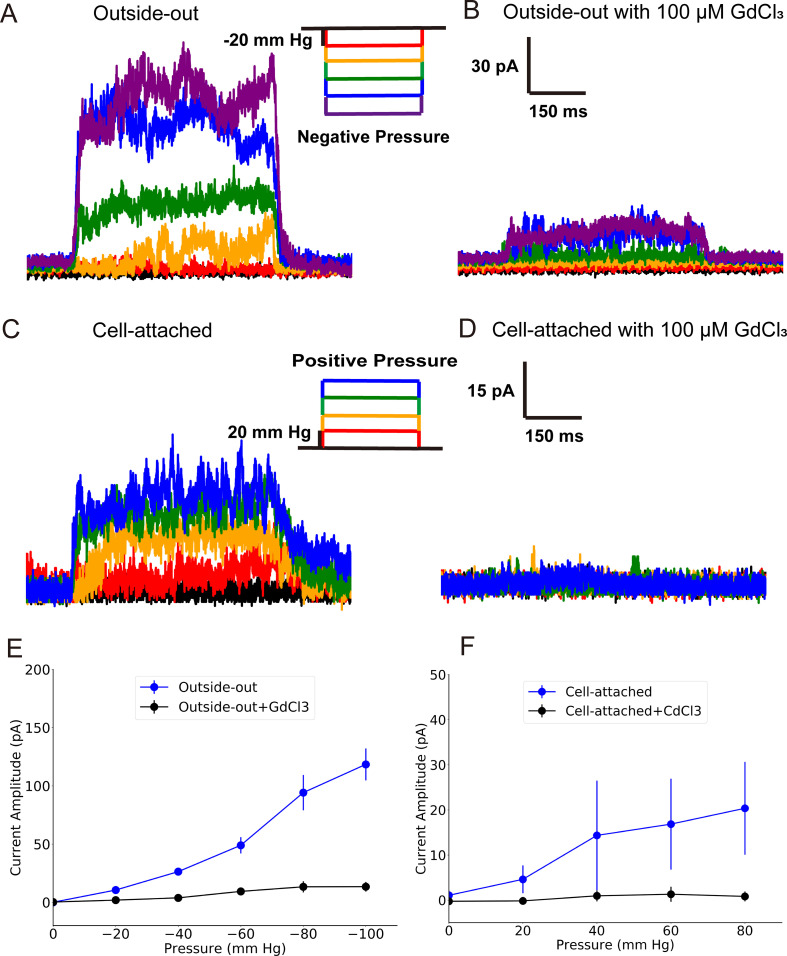
(A) The simulation systems. The NompC was divided into two subsystems, denoted by the cyan and red rectangular boxes, for the molecular dynamics (MD) simulations. (B−D) The transmembrane (TM) pore size evolution for the force-free (B), pulling/stretch (C), and pushing/compression (D) simulations, calculated from the MD trajectories FI0, SI0, and CI0 (Supplementary file 1a), respectively. (E) A schematic figure of the cell-attached patch-clamp electrophysiological experiment for NompC. (F) Representative traces of the electrophysiological measurements for the S2 blank cell and NompC-expressed cell, showing that there are significantly larger signals under positive pressure (PP) in the presence of NompC. (G) The mean and standard deviation (SD) of the mechano-gated currents in the S2 blank and NompC expressing cells under positive (PP) and negative pressure (NP) in the cell-attached patch-clamp experiments (S2_NP: n = 6; S2_PP: n = 6; NompC_NP: n = 5; NompC_PP: n = 7). All of the error bars denote ± SD.

