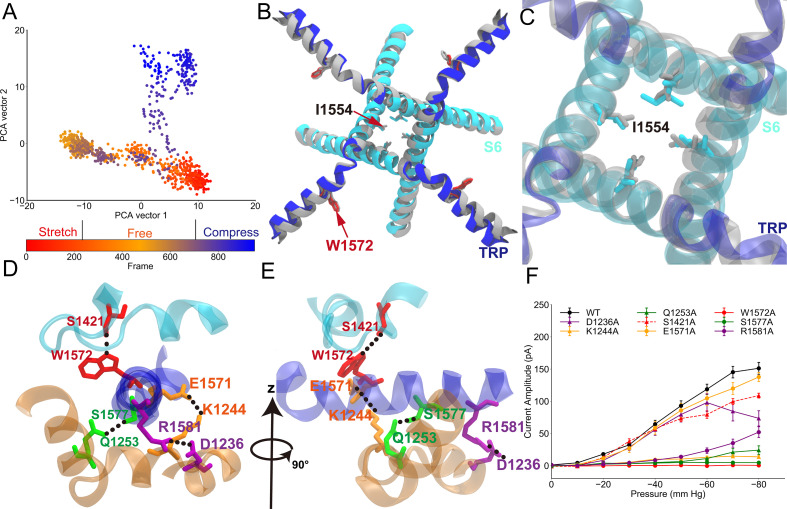
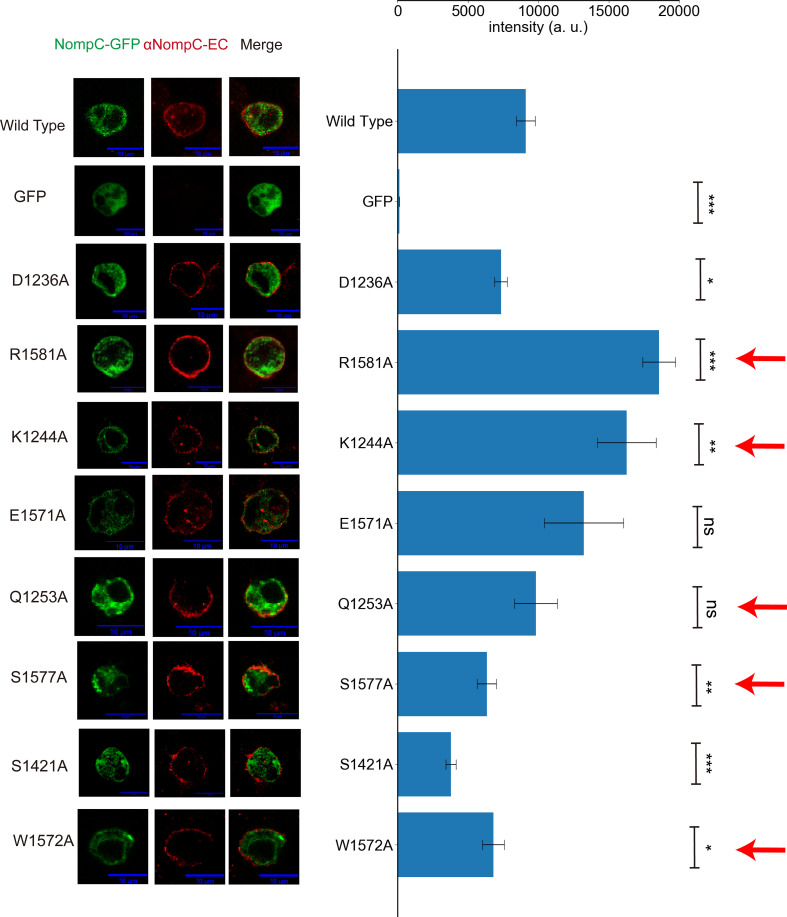
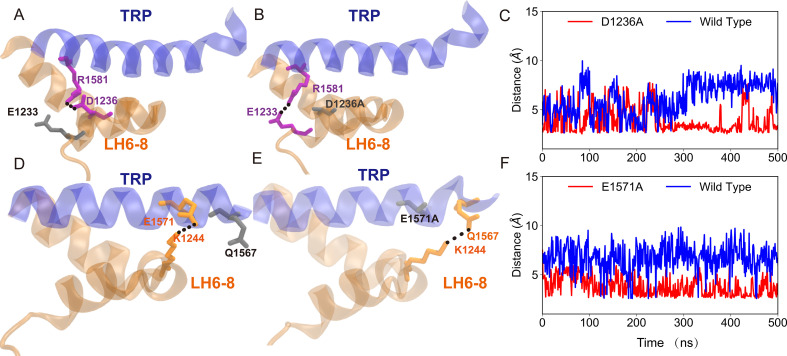
Figure 2. Conformational changes of the transient receptor potential (TRP) and transmembrane (TM) domains during gating.
(A) Principal component analysis (PCA) of the molecular dynamics (MD) simulation trajectories (FI0, SI0, and CI0 in Supplementary file 1a). The projections on the second eigenvector can distinguish the conformations under pulling (red) or pushing (blue). (B) The overlaid extreme structures along the second eigenvector of the PCA. The most closed conformation (silver) and open conformation (cyan) showed the global changes of the TRP domain during gating: a clockwise rotation. (C) The orientation and position of the gate residue, I1554, in the most closed (silver) and open (cyan) conformations in the simulations. (D, E) The residues forming four stable hydrogen bonds between the TRP and LH domains. (F) The mean and standard deviation (SD) of the mechano-gated current of the wild-type NompC, as well as the mutants W1572A, S1421A, Q1253A, S1577A, K1244A, E1571A, D1236A, and R1581A, under negative pressure in the outside-out patch-clamp experiments (wild type: n = 13; W1572A: n = 7; S1421A: n = 6; Q1253A: n = 6; S1577A: n = 5; K1244A: n = 6; E1571A: n = 6; D1236A: n = 9; R1581A: n = 6). All of the error bars denote ± SD. Hydrogen bonds are indicated by dashed lines (D, E).

