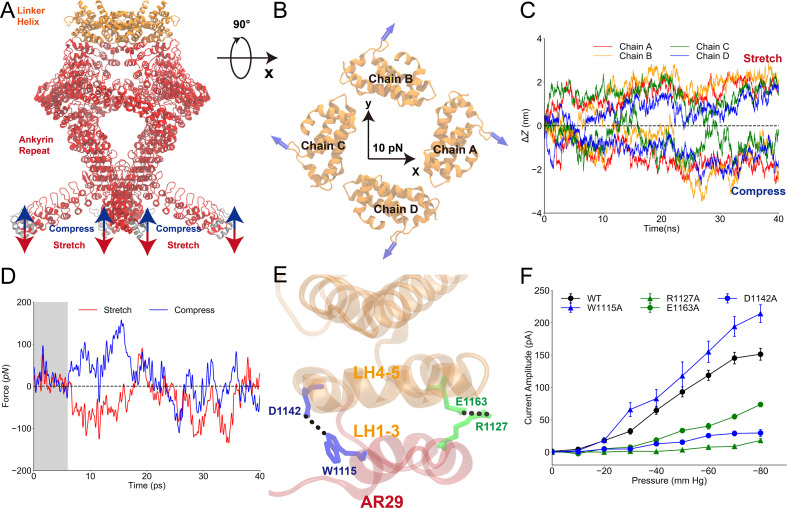
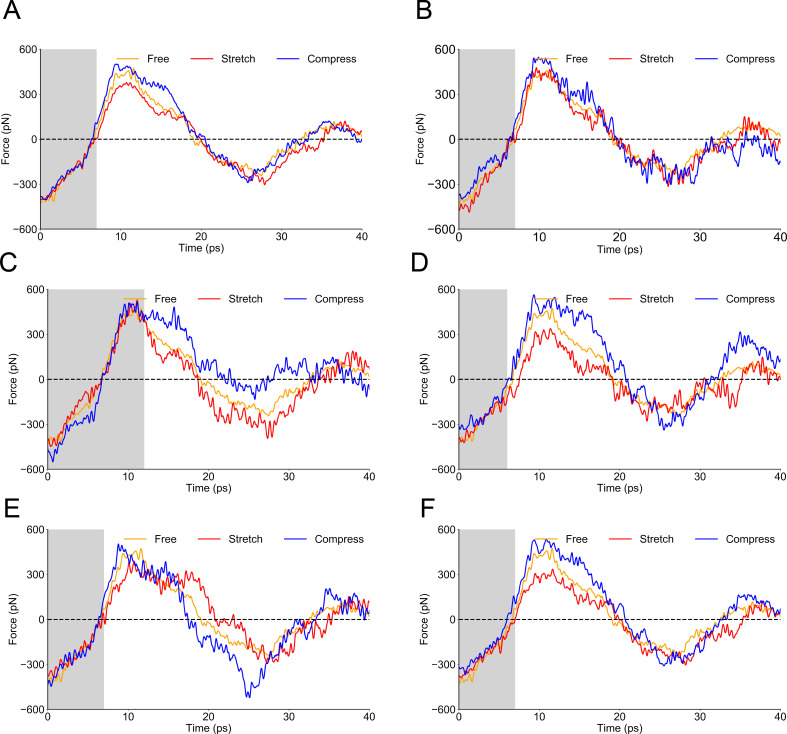
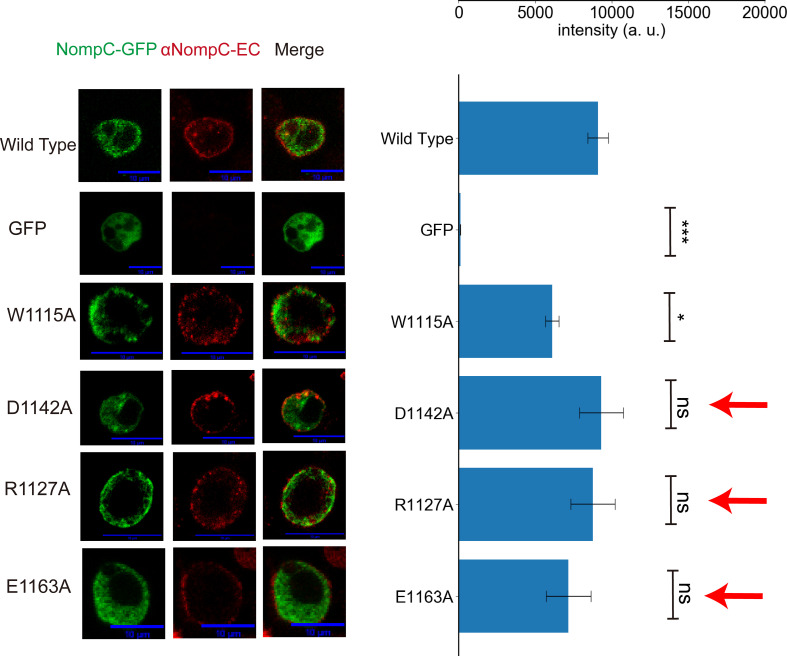
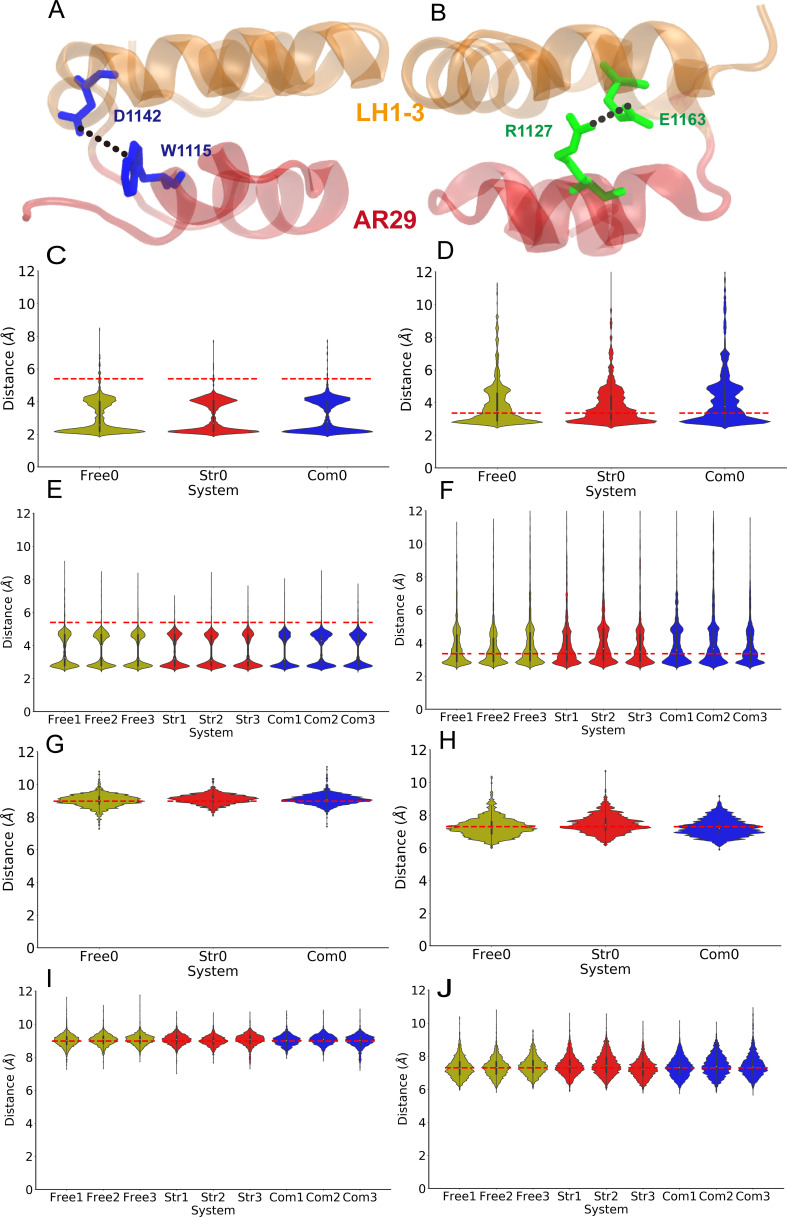
Figure 3. Mechanical properties of the ankyrin repeat (AR) region.
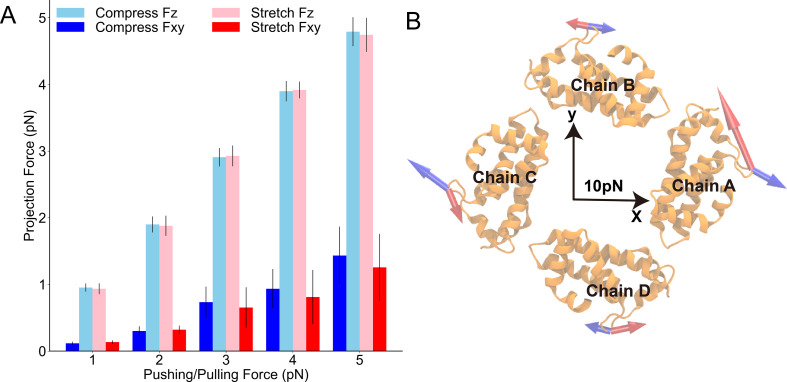
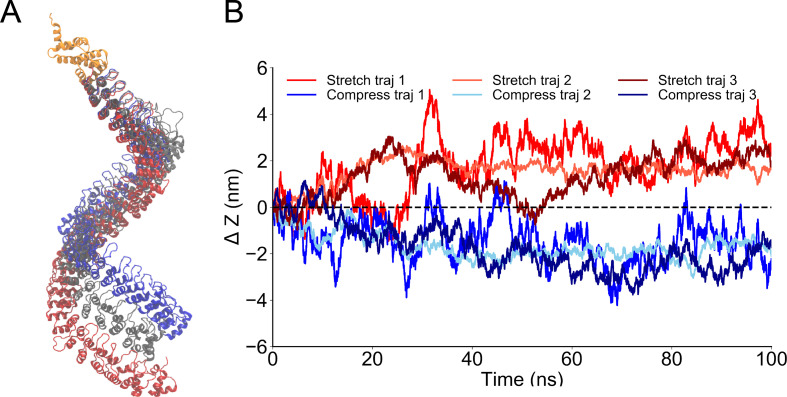
(A) The simulation system in which the linker helix (LH) domain (orange) was restrained and a pushing or pulling force was applied to the first AR (gray). (B) Projection of the reaction forces of the restraints on the LH domain (same as the forces exerted on the transient receptor potential [TRP] domain by the LH domain) on the plane parallel to the membrane surface, showing that a torque is generated that will drive the LH and TRP domain to rotate clockwise (looking from the intracellular side). The calculation was based on the molecular dynamics (MD) trajectories CII1 and symmetrized from the original data as shown in Figure 3—figure supplement 1. (C) The AR region was compressed/stretched by a pushing/pulling force of 5 pN and reached its equilibrium length within 40 ns simulations (from MD trajectories SII1 and CII1 with respect to FII1). (D) The evolution of the net average reaction forces of the restraints on the LH domain when pushing (blue) or pulling forces (red) were applied to AR1, calculated from the MD trajectories FII2-6, CII2-6, and SII2-6 (Supplementary file 1b). A clear deviation occurred at around 7-8 ps during the simulation time, indicating that the forces applied to AR1 have reached LH at the time. (E) The residues forming two stable hydrogen bonds between the LH domain and AR29. (F) The mean and standard deviation (SD) of the mechano-gated current of the wild-type NompC and the mutants W1115A, D1142A, R1127A, and E1163A, under negative pressure in the outside-out patch-clamp experiments (wild type: n = 13; W1115A: n = 5; D1142A: n = 4; R1127A: n = 5; E1163A: n = 6). All of the error bars denote ± SD. Hydrogen bonds are indicated by dashed lines (E).

