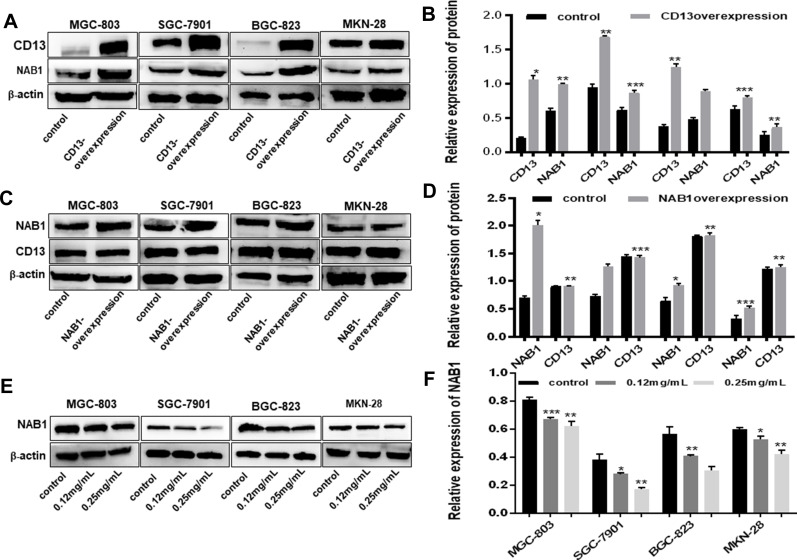
Figure 4.
NAB1 is a putative downstream signal molecule of CD13. (A) When CD13 was overexpressed, the level of NAB1 was also increased, indicating that NAB1 is a target molecule of CD13. (C) When NAB1 was overexpressed, CD13 expression was not affected, providing further details on the relationship between NAB1 and CD13. (B and D) The column graph shows the relative grayscale value of each band compared with that of β‑actin. (E) Western blot analyses of NAB1 expression in MGC-803, SGC-7901, BGC-823 and MKN-28 human gastric cells treated with 0.12 mg/mL or 0.25 g/mL Ubenimex. (F) The column graph shows the relative grayscale value of each band compared with that of β‑actin. *P<0.05, **P<0.01 and ***P<0.001.

