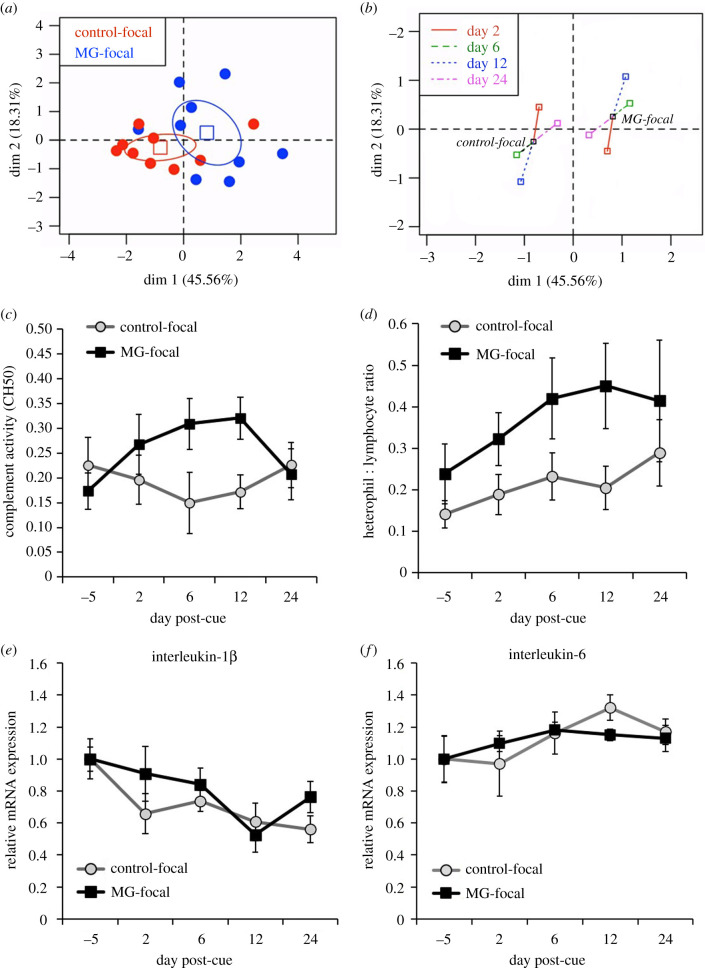
Figure 2.
Effects of disease-related social information on immune profiles in domestic canaries. (a) Multifactor analysis plot of dimensions 1 and 2 for immune profiles (heterophil/lymphocyte ratio, complement activity) in birds viewing sick conspecifics (MG-focal: N = 9) or healthy conspecifics (control-focal: N = 9). Individual points represent individual birds and ellipses represent 95% confidence regions for each treatment. (b) Partial points plot showing the contributions of each timepoint (days 2, 6, 12 and 24) to the divergence in immune profiles between each treatment. (c) Hemolytic complement activity (CH50), (d) heterophil/lymphocyte ratio and relative mRNA gene expression of (e) interleukin-1β and (f) interleukin-6 in birds exposed to a cue of infection (MG-focal) or healthy conspecifics (control-focal). The points denote average values (±s.e.) of birds in the control-focal (n = 9) and MG-focal (n = 9) treatments.

