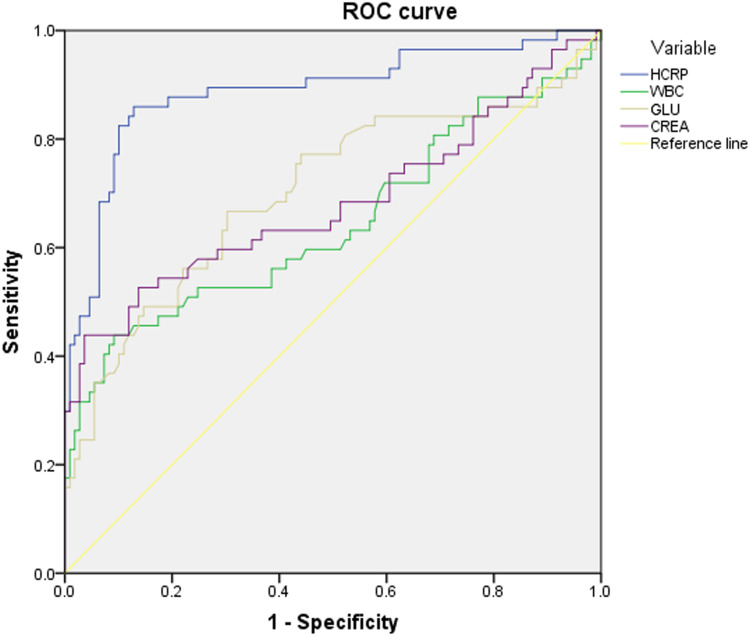
Figure 1.
ROC and AUC for high-sensitivity C-reactive protein (HCRP), white blood cell (WBC), fasting blood glucose (GLU) and creatinine (CREA) levels; from WBC, creatinine, GLU to HCRP, the respective AUC indicated an increasingly larger area, from 0.645 (95% CI 0.548 to 0.742) to 0.888 (95% CI 0.828 to 0.947).

