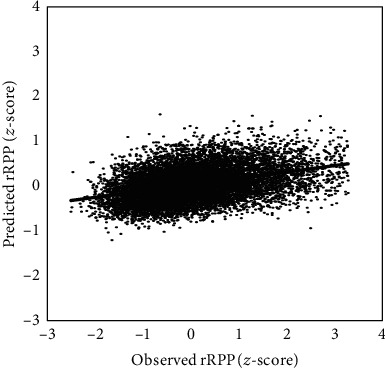
Figure 1.

Scatterplot of observed rRPP (z-score) versus predicted rRPP (z-score). Observed rRPP was calculated from measured pulse and blood pressure. This iteration was chosen at random (out of 100 model iterations) to visualize prediction performance over a range of observed rRPPs. Line represents linear line of best fit.
