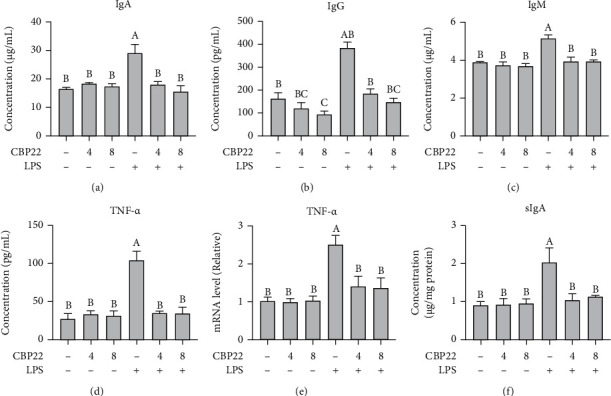
Figure 5.

Effects of CBP22 on immune function in LPS-stimulated mice. (a–d) The concentration of IgA (a), IgG (b), IgM (c), and TNF-α (d) in serum. (e) Real-time PCR analysis of TNF-α mRNA expression in the jejunum. (f) Concentration of sIgA in the ileum. The q-PCR results are presented relative to those of GAPDH. The data are expressed as the mean ± SEM, n = 10 biological replicates; bars with different small capital letters are statistically different from one another.
