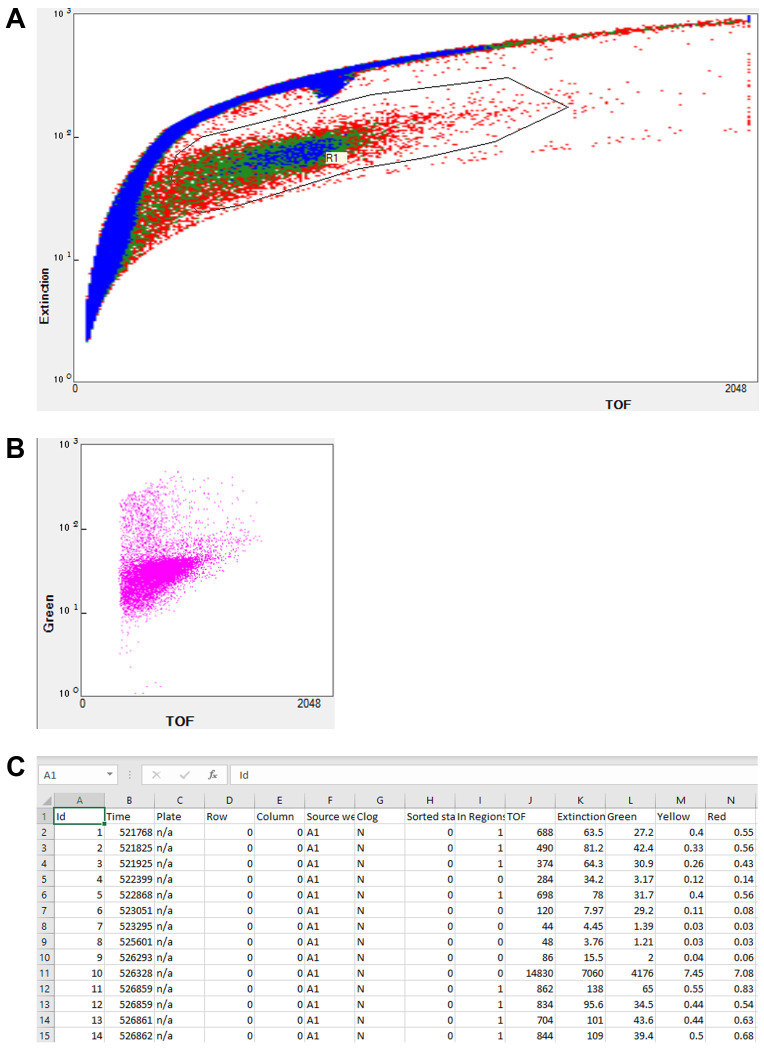
Figure 1. Flow vermimetry (with COPAS FP BioSorter) fluorescence measurement method.
The FlowPilot software display consists of (A) a customizable plot for sample detection and selection, including customizable regions of interest (R1) and (B) customizable output plots. (C) Example of FlowPilot output opened in Microsoft Excel.

