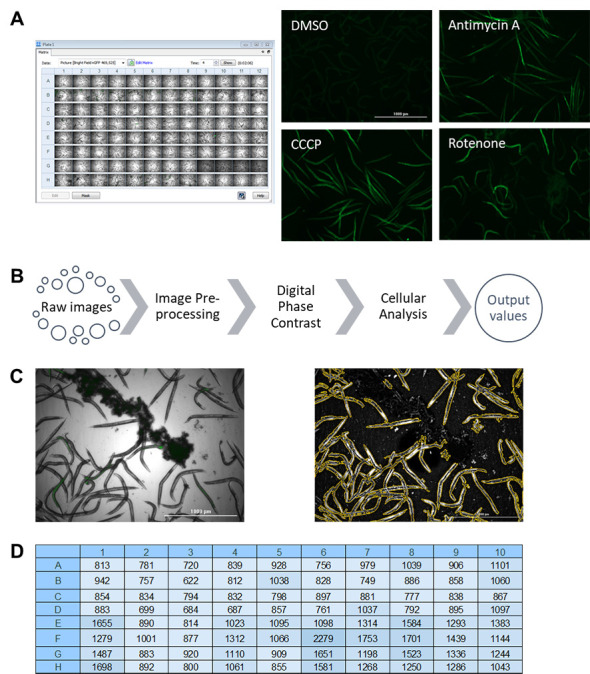
Figure 2. Pipeline for image acquisition and fluorescence quantification with Cytation5 and Gen5 software (BioTek).

(A) Raw images obtained after imaging a 96-well plate, including representative fluorescence images of C. elegans reporter strain responsive to mitochondria-targeting drugs. (B) A pipeline for fluorescence quantification from raw images. (C) Example of worm identification before (left) and after (right) quantification pipeline. (D) Example of obtained fluorescence values from pipeline analysis after exporting into Microsoft Excel.
