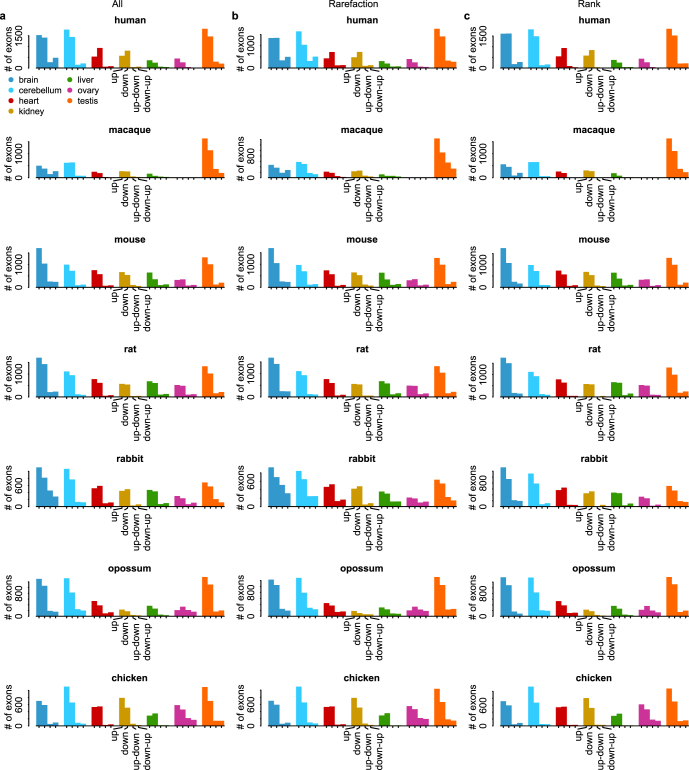
Extended Data Fig. 4. Frequencies of the four main developmental cassette exon usage patterns across organs and species.
a, Numbers of devAS cassette exons with each of the four patterns are shown for all organs and species. Patterns are shown in the order indicated for kidney (that is, up, down, up-down and down-up). b, Same as (a) but samples were rarefied before the pattern analysis to make their distribution across development more even. For each species and organ, we split the whole developmental span (in a logarithmic scale of days post-conception, DPC) into 10 equally sized bins. Then we calculated the minimal number of samples per bin and randomly took as many (but not less than one) samples from each bin. c, Same as (a) but a rank of the developmental stage was used instead of the log(DPC) for the pattern analysis. The analyses in (b) and (c) were designed to test the dependence of the pattern analysis on the evenness of the distribution of samples across development.

