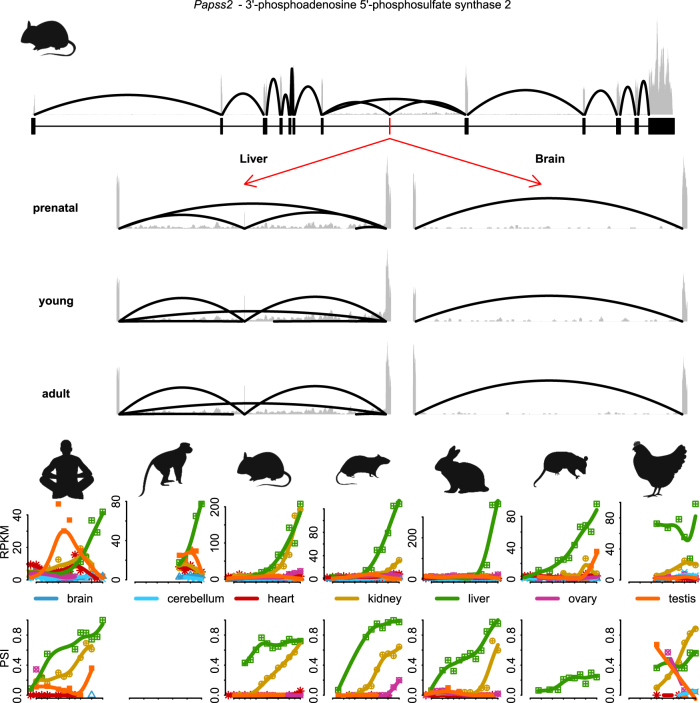
Extended Data Fig. 7. Liver-specific microexon in the Papss2 (3’-phosphoadenosine 5’-phosphosulfate synthase 2) gene.
Total read coverage of Papss2 (based on mouse RNA-seq libraries) is shown on the top. Gray lines/areas indicate the coverage of reads mapped to a given genomic position; black arcs indicate reads mapped to exon-exon junctions (height of the arc is proportional to the number of mapped reads). Only junctions that fall completely within the region and with coverage greater than 5% of coverage relative to the most covered junction are shown. Exons are shown by black rectangles below, whereas the alternative microexon is marked in red. Zoomed read coverages of the microexon in liver and brain for all prenatal, up to 24 days postnatal (young), and from 25 days postnatal (adult) samples, respectively, are shown in the middle. Gene expression levels (RPKM) and alternative splicing (PSI) profiles for individual species are shown below. Patterns are shown for matched developmental stages18. Different organs are shown in different colors (color code as used throughout the paper; for example Fig. 1). The microexon is 15 nt long (coordinates: 19:32646329-32646343; genome assembly: GRCm38). Species icons (except human) are from a previous study18.

