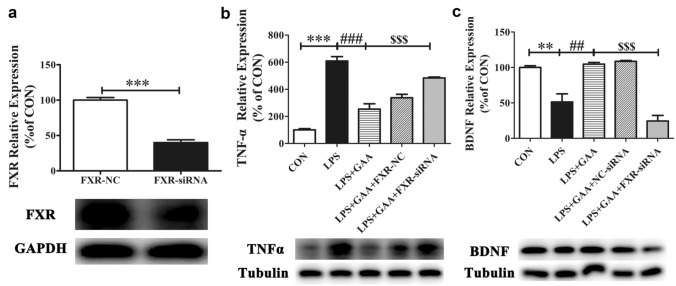
Fig. 8.
The effects of FXR knock-down on GAA-mediated expression of FXR, TNF-α and BDNF levels in LPS-stimulated BV2 microglial cells. The protein levels of FXR (a), TNF-α (b) and BDNF (c) were detected by Western blot. After normalization to the CON, data from three independent experiments was analyzed using one-way ANOVA followed by post hoc Turkey tests and were presented as Mean ± SEM. (***P < 0.001 FXR-NC vs. FXR-si-RNA; **P < 0.01, ***P < 0.001 LPS vs. CON; ##P < 0.01, ###P < 0.001 LPS + GAA vs. LPS; $$$P < 0.001 LPS + GAA + FXR-si-RNA vs. LPS + GAA)

