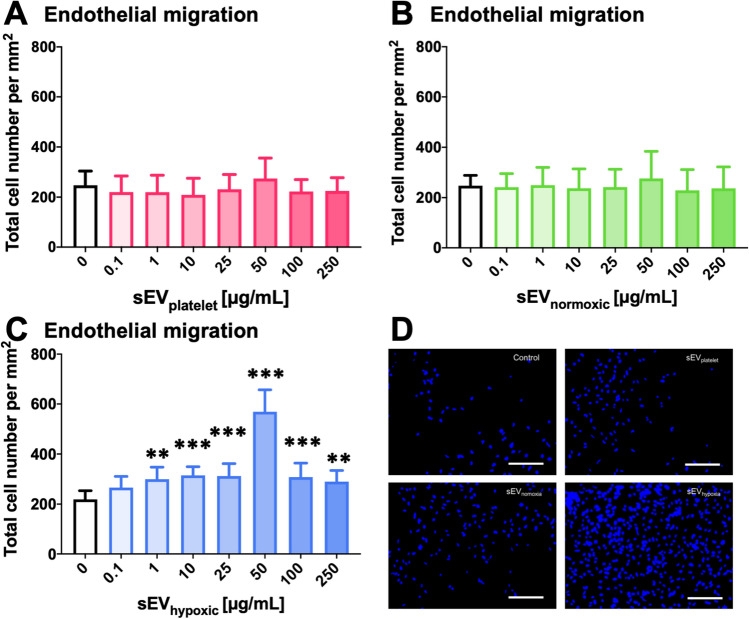
Fig. 2.
sEVs from hypoxic MSCs increase cerebral microvascular endothelial cell migration. Relative number of migrating hCMEC/D3 cells, determined in a modified Boyden chamber transwell migration assay, after exposure to different concentrations of A sEVs obtained from MSC culture media that contain platelet lysates (sEVplatelet), B sEVs obtained from MSCs (
source 41.5) cultured under ‘normoxic’ conditions (21% O2; sEVnormoxic) or C sEVs obtained from MSCs (source 41.5) cultured under hypoxic conditions (1% O2; sEVhypoxic). In D, representative microphotographs for hCMEC/D3 cells exposed to control conditions or sEVs at a 50 µg/mL concentration are shown. Data are mean ± SD values (n = 9 independent experiments). *p < 0.05, **p < 0.01, ***p < 0.001 compared with control. Scale bars: 125 µm in D

