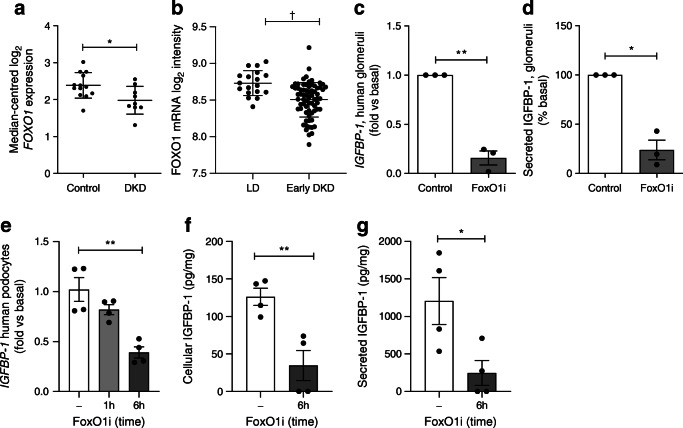
Fig. 2.
IGFBP-1 expression is controlled by FoxO1 in human glomeruli and podocytes. (a) Nephroseq: FOXO1 expression in the ‘Woroniecka Diabetes Glom’ dataset, healthy living donor (n = 13) vs DKD (n = 9), *p = 0.02, Welch’s t test (q value = 0.10). (b) Expression (log2 mRNA intensity) of FOXO1 in the Pima type 2 diabetes cohort with early DKD (Early DKD, n = 69) vs living donors (LD, n = 18), †q = 0.0003. (c) qPCR results of IGFBP-1 mRNA in ex vivo human glomeruli and (d) IGFBP-1 concentration in glomerular media after FoxO1 inhibition (50 ng/ml AS1842856 FoxO1 inhibitor) for 10 days, n = 3 individuals, *p < 0.05, **p < 0.01, t test. (e) qPCR results of IGFBP-1 mRNA expression (n = 4), **p < 0.01 one-way ANOVA with Tukey’s multiple comparison test. (f) IGFBP-1 levels in podocyte lysates normalised to total protein (n = 4), **p = 0.007, t test. (g) IGFBP-1 concentration in cell-free podocyte media following 6 h FoxO1 inhibition (50 ng/ml AS1842856) (n = 4), *p = 0.03, t test, 6 h vs basal. FoxO1i, FoxO1 inhibitor; qPCR, quantitative PCR

