Fig. 4.
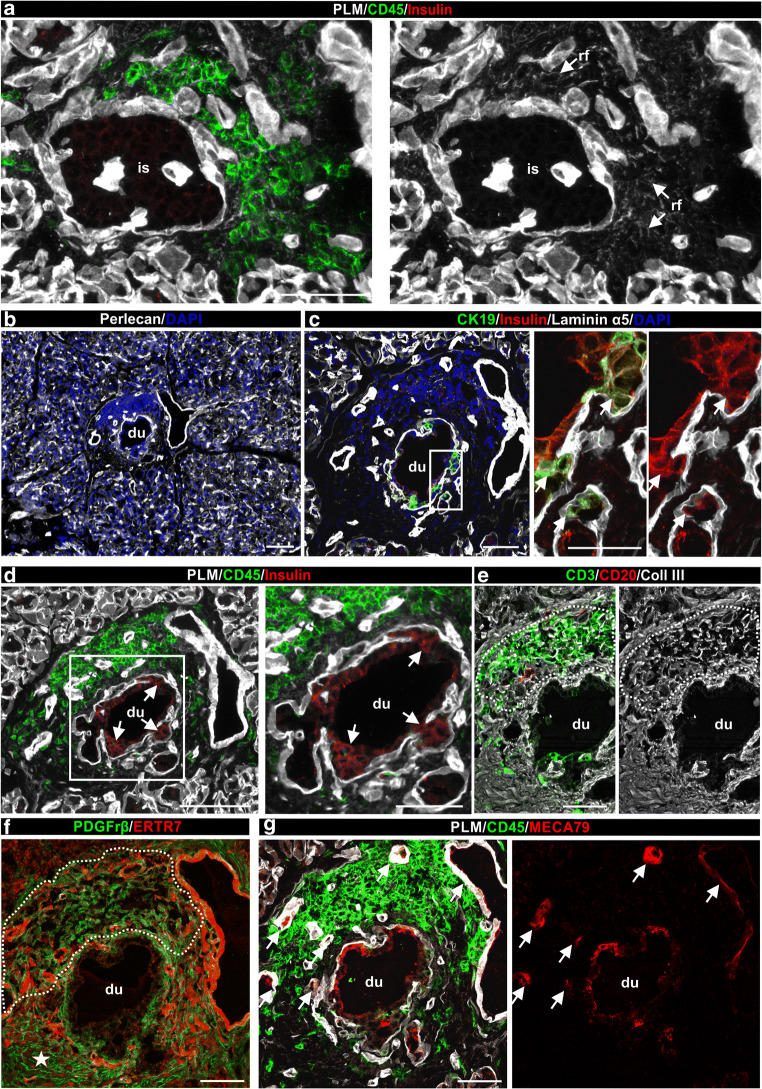
TLOs associated with insulin-negative islets and with the wall of pancreatic ducts in human type 1 diabetes. (a, d) Representative immunofluorescence images of pancreas sections (from donor no. 6195) triple-stained for insulin, PLM and CD45 showing inflamed pancreatic islet (a) and pancreatic duct (d). Arrows point to RFs (a) and to insulin-positive cells in the pancreatic duct (d). (b) Low magnification image of a consecutive section of the duct stained for BM marker perlecan and DAPI to visualise the surroundings of the inflamed duct. There was no islet detected in close vicinity to the duct. (c) Triple immunofluorescence for CK19, insulin and laminin α5 to mark ductal epithelial cells, beta cells and BMs, respectively. Boxed area is shown at higher magnification. Arrows in (c) mark insulin-positive cells among the pancreatic duct epithelial cells. (e) Immunofluorescence staining of pancreatic duct for CD3+ T cells, CD20+ B cells and collagen type III to mark RFs. (f) Double staining of pancreatic duct for PDGFrβ+ and ERTR7. Note the different PDGFrβ staining pattern at sites of leucocyte accumulation (dashed line) compared with the non-inflamed region of the duct (star). (g) Staining for MECA79 reveals HEVs (arrows) in inflamed pancreatic duct and some signal on the surface of the duct epithelium. Scale bars, 100 μm (a, b, d); 50 μm (c, e–g; and d [area shown at higher magnification]) or 25 μm (c [area shown at higher magnification]). Coll, collagen; du, duct; is, islet; rf, RFs

