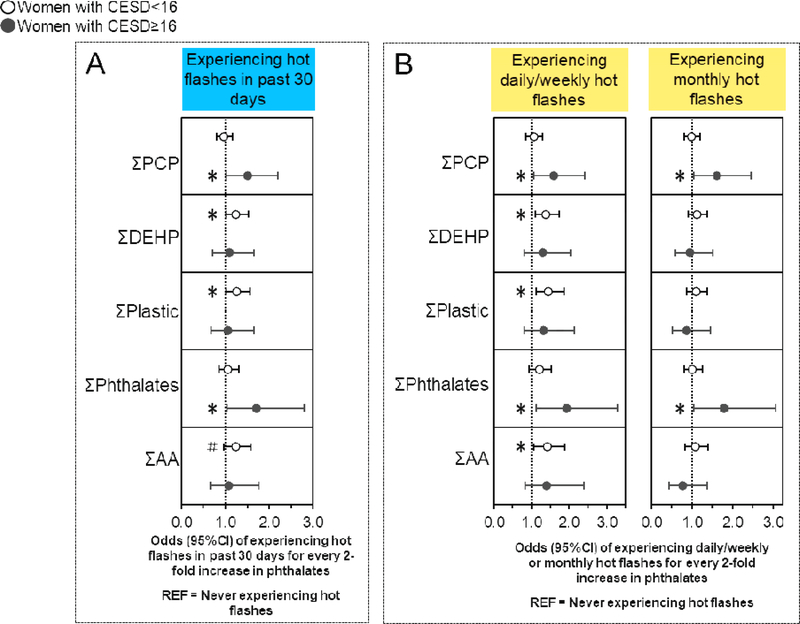
Figure 4. Associations of urinary phthalate concentrations with hot flashes stratified by CESD score.
Binary logistic regression models evaluated associations of urinary phthalate concentrations with the odds of experiencing hot flashes in the last 30 days compared to never having hot flashes (n=635), while multinomial logistic regression models evaluated associations of urinary phthalate concentrations with the odds of experiencing daily/weekly or monthly hot flashes compared to never experiencing hot flashes (n=697). All models were stratified by CESD score and were adjusted for age, race/ethnicity, education, alcohol consumption, smoking status, medication use, menopause status, and body mass index. Data are presented as odds ratio (circles) and 95% confidence interval (solid lines) for every two-fold increase in urinary phthalate concentrations. Confidence intervals that do not cross the null are significant at #P<0.10 and *P<0.05.

