
Fig. 2.
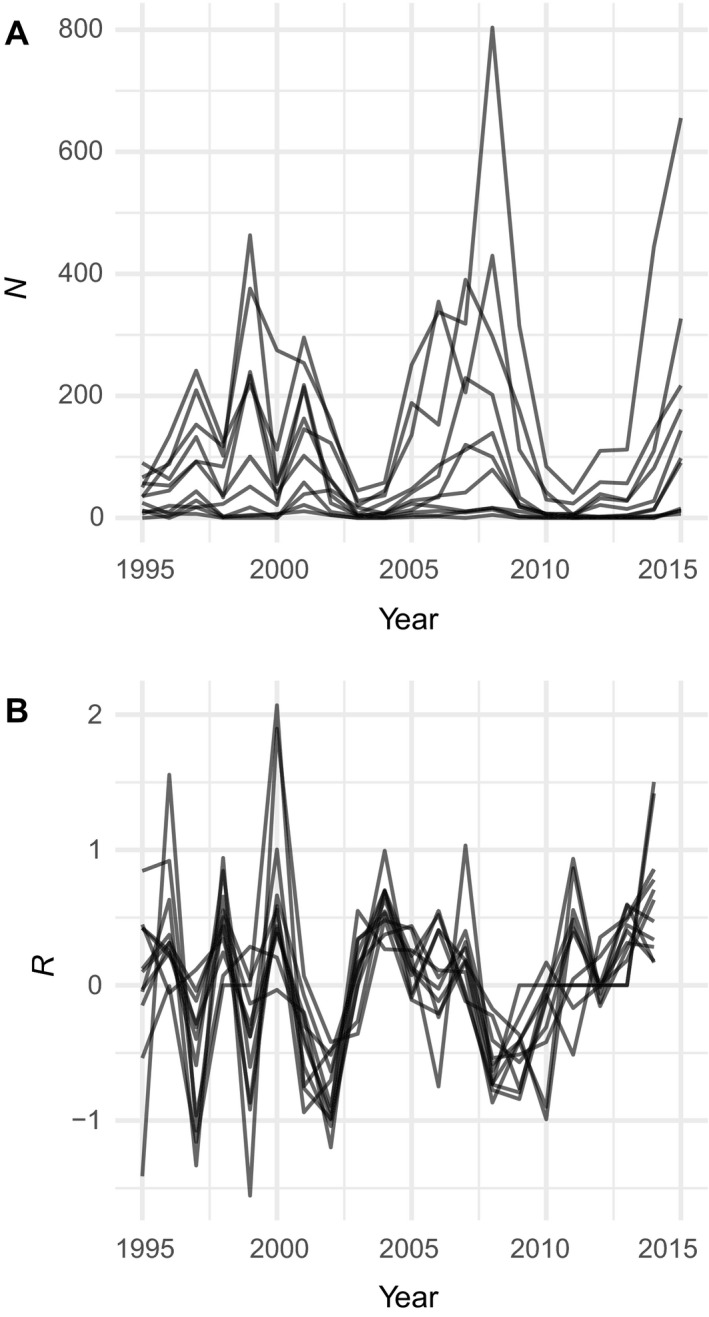
Time series of Parnassius smintheus butterfly abundance from Roland and Matter, (2016a ) for (A) raw population sizes and (B) log population growth rates. Each line is a subpopulation from one of 11 distinct meadows. N is population size; R is estimated population growth rate.