
Fig. 4.
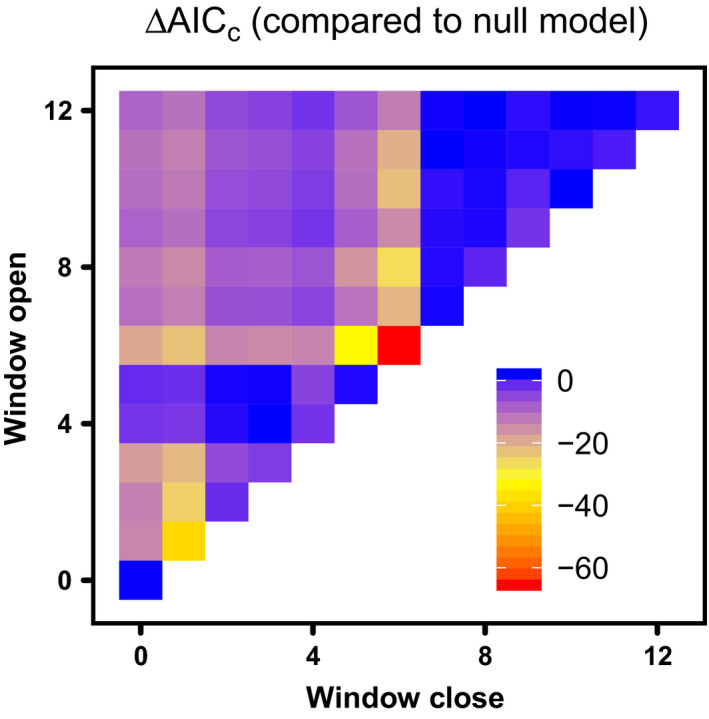
Sliding window analysis for mean temperature. The colors show the differences in AIC between a no‐climate null model and models fit to temperature averaged over windows that open and close a certain number of months before June, when populations are censused.