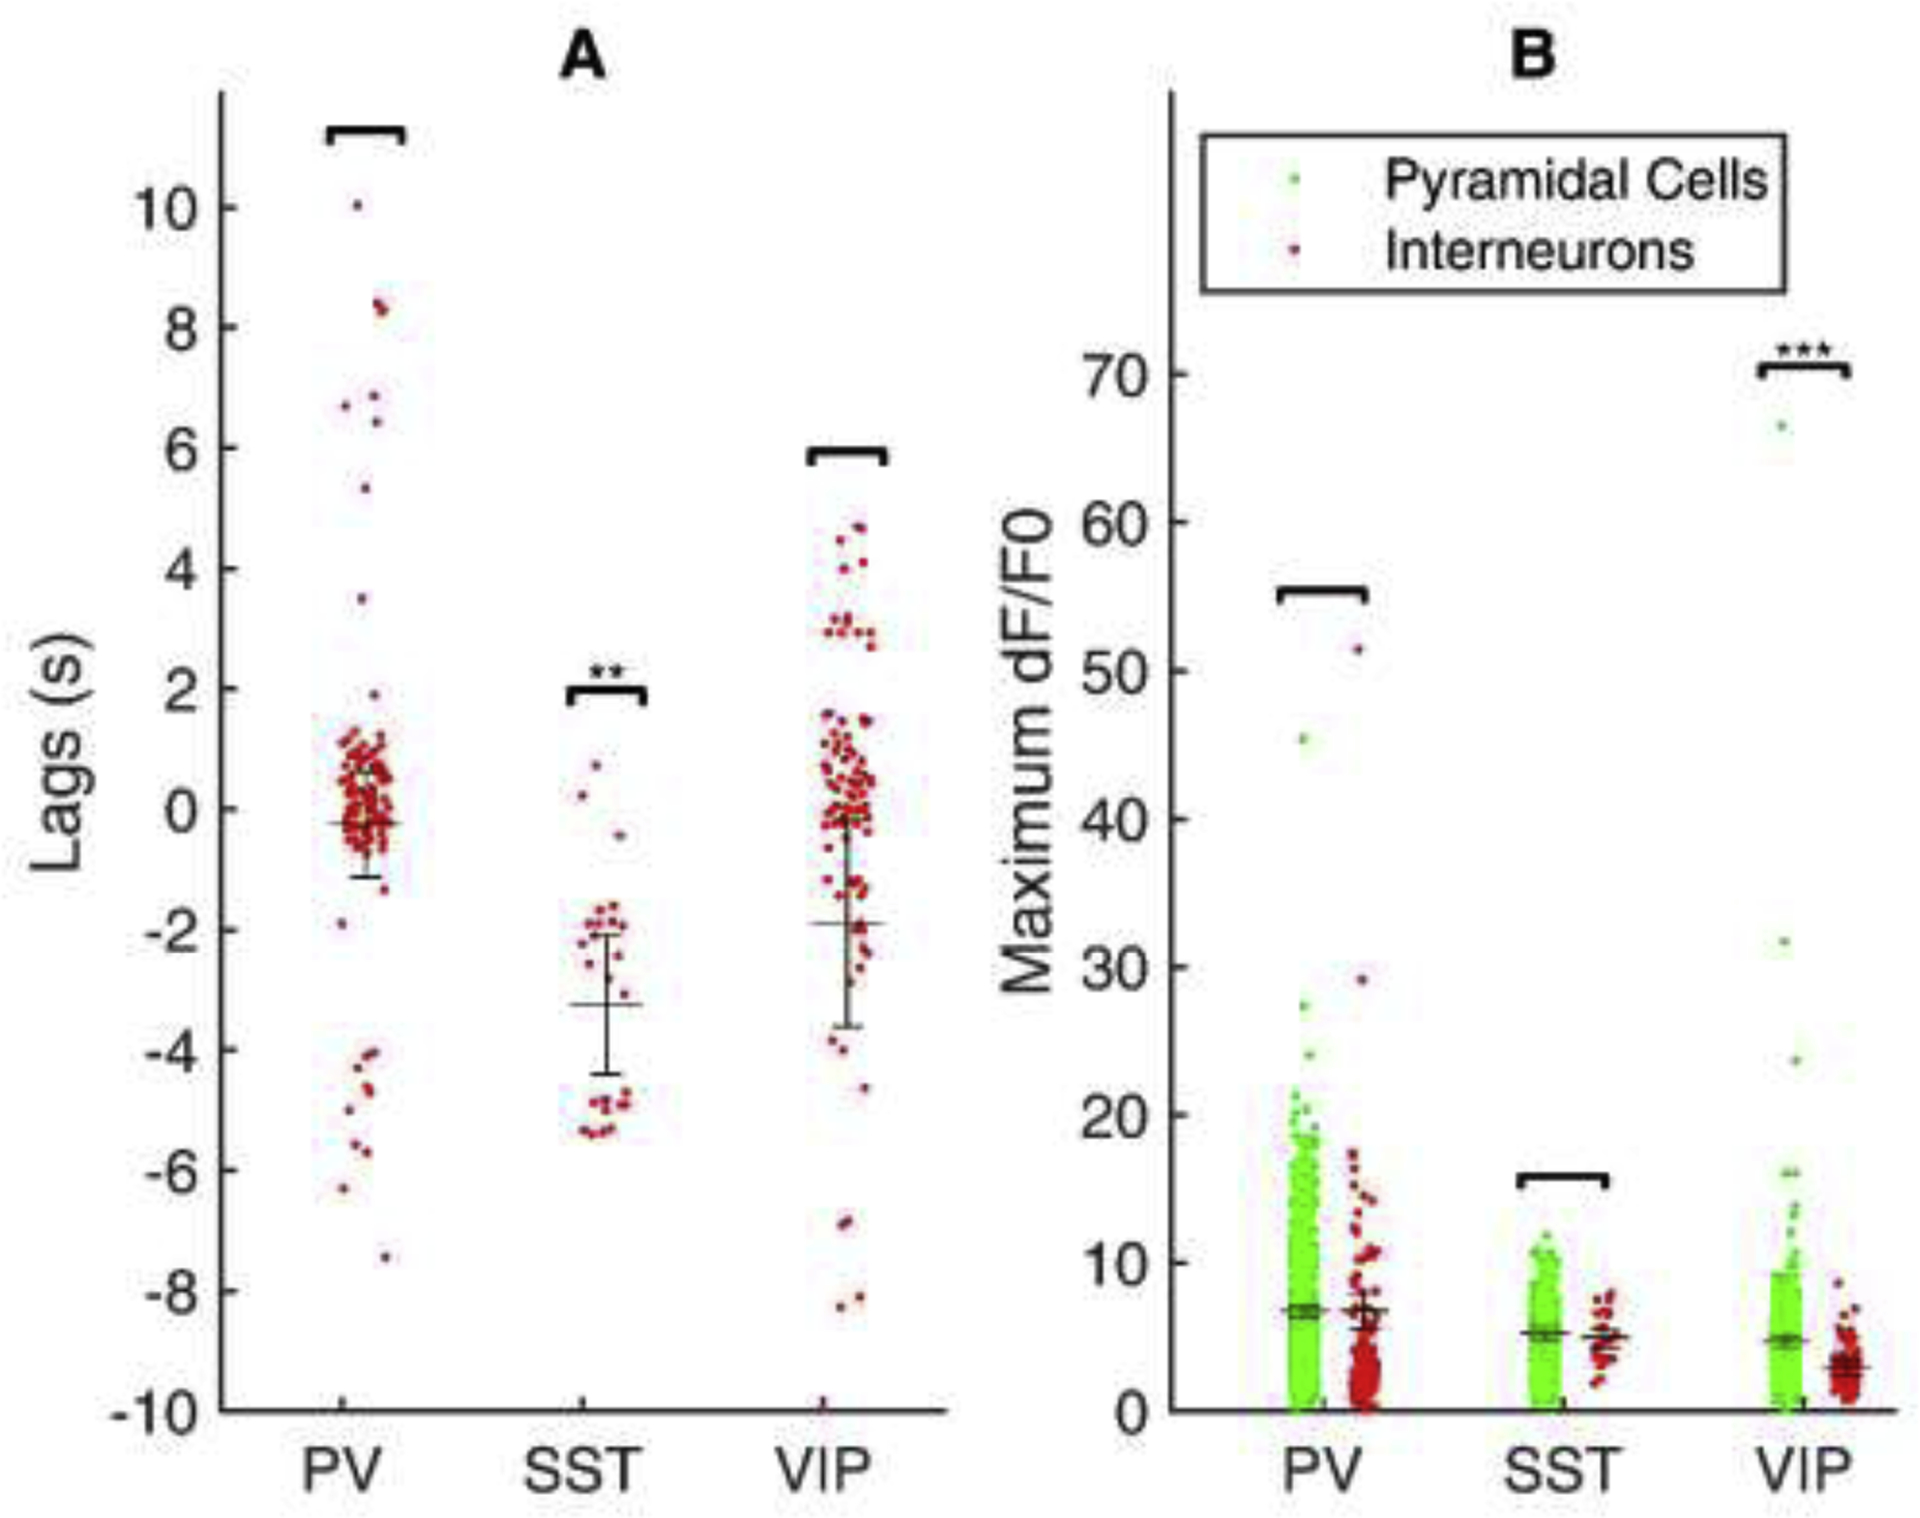
Fig. 5:

Recruitment lags and response of distinct subclasses of interneurons during seizure.
(A) Individual points shows the lag of each cell corresponding to the seizure onset. SST INs alone have shown a significant difference compared to seizure onset (p < 0.01). (B) Individual points shows maximum fluorescence (dF/F0) of each cell. A significant difference is shown for VIP cells alone (p < 0.001). The horizontal line depicts the mean, and the error bar reports the standard error. Significance is tested with mixed modeling considering each seizure as a random factor.
