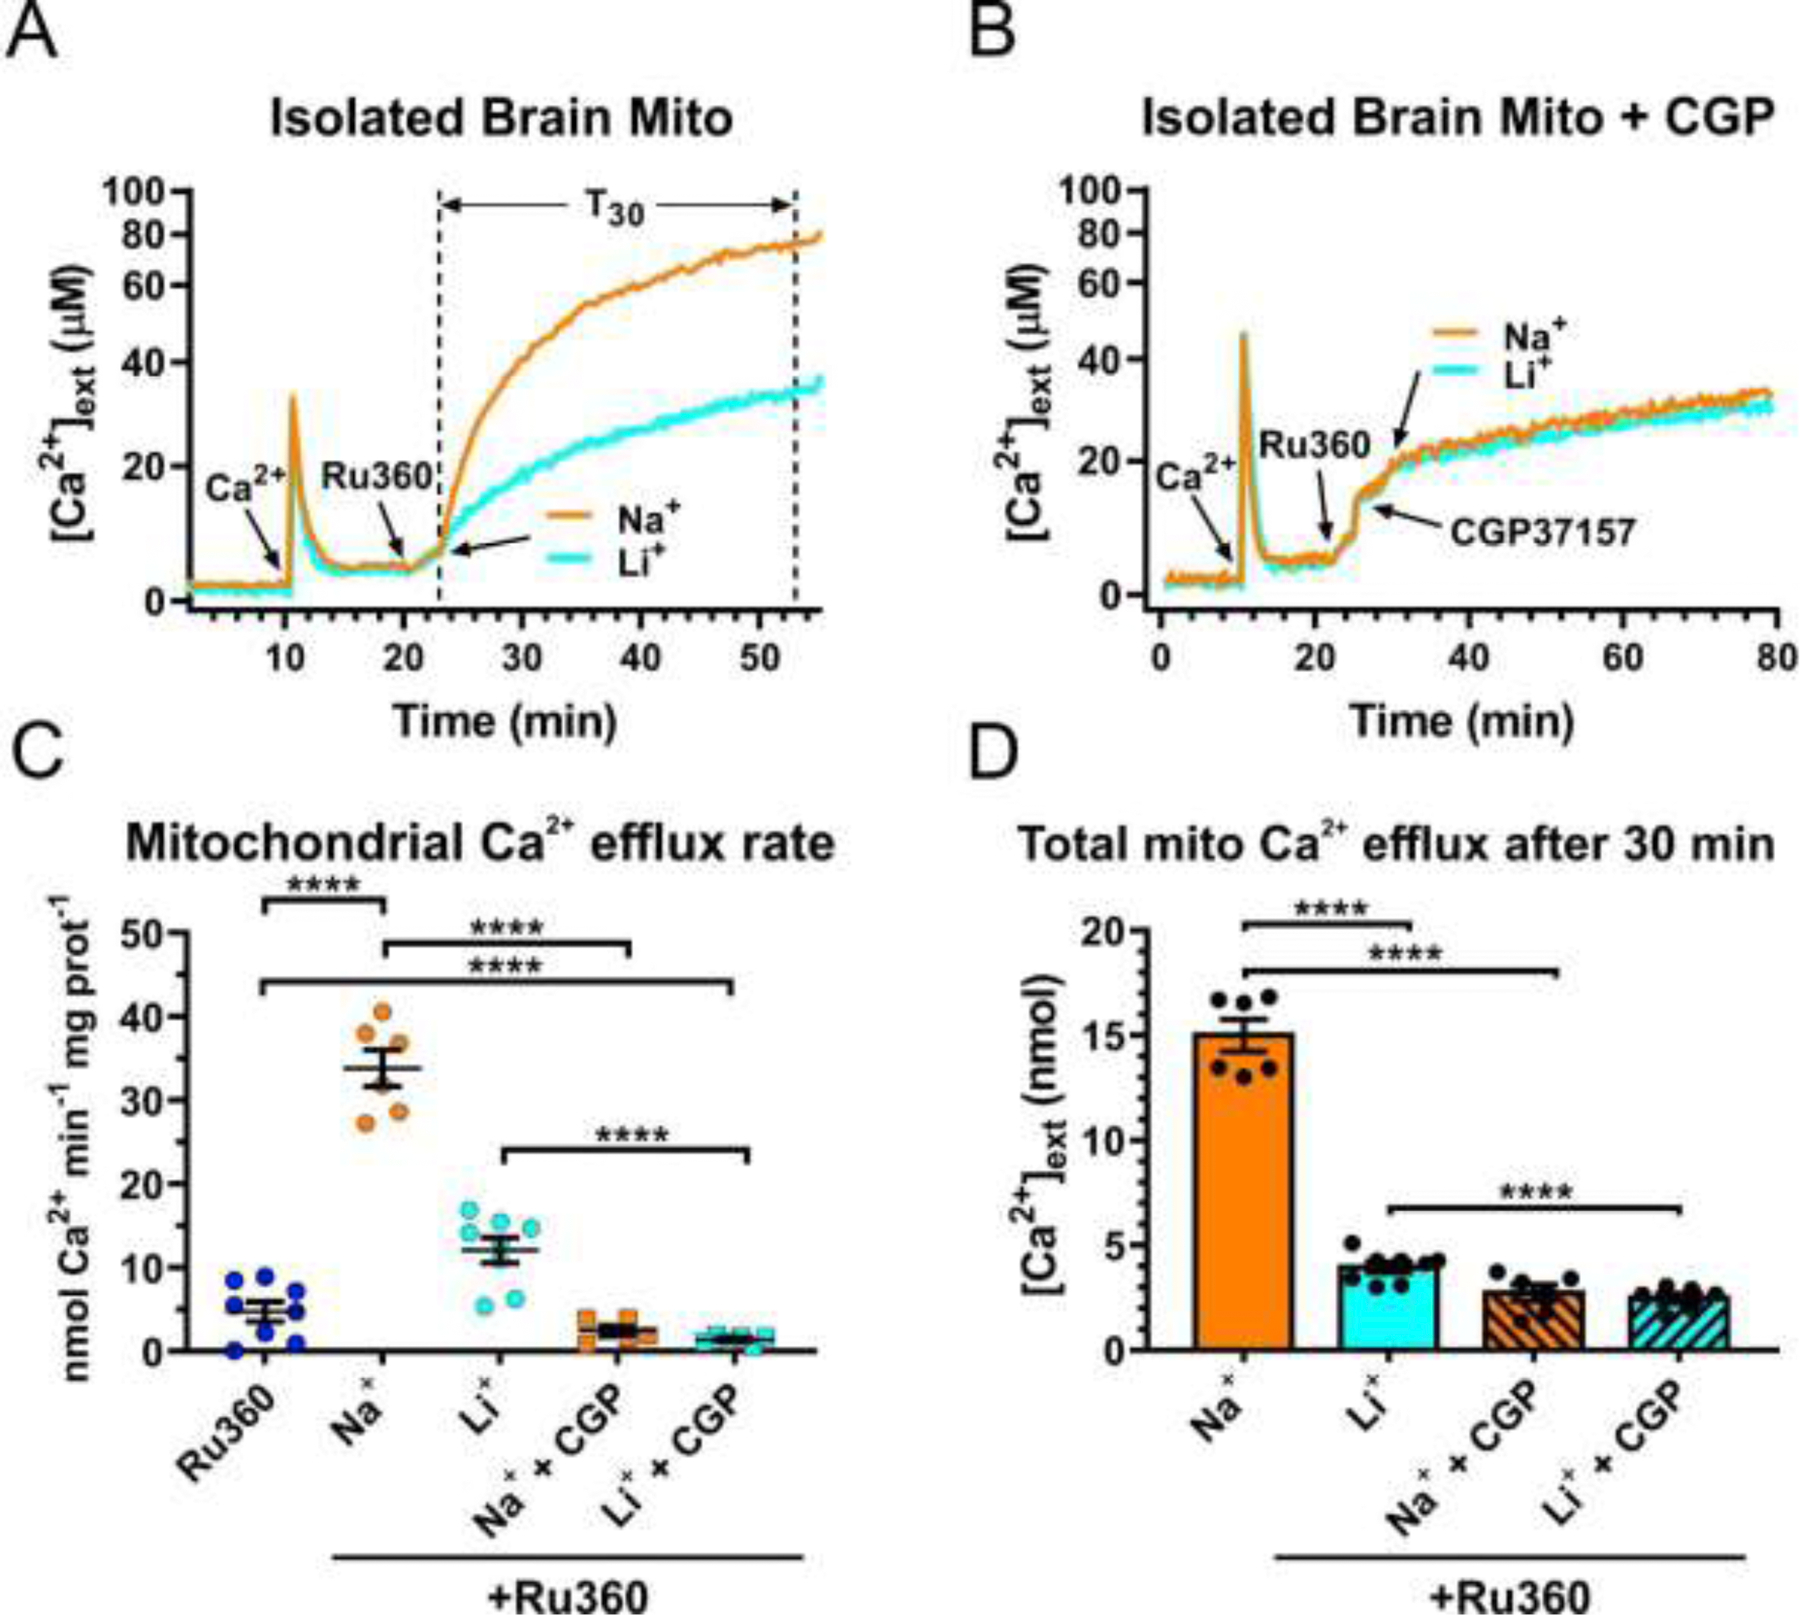
Figure 2. Unlike Na+, Li+ fails to effectively stimulate Ca2+ efflux from mouse brain mitochondria.

(A) and (B), Representative traces of extracellular Ca2+ ([Ca2+]ext) in a suspension of isolated brain mitochondria illustrating the protocol for measuring Na+ (Li+)-induced Ca2+ efflux from mitochondria in the absence (A) or presence (B) of the mtNCX inhibitor CGP37157 (30 µM). First, a pulse of Ca2+ (100 µM; arrow) was added to a suspension of mitochondria, followed by addition of the inhibitor of mitochondrial Ca2+ uniporter, Ru360 (10 µM; arrow) to block mitochondrial Ca2+ uptake; then either 20 mM Na+ (orange line) or Li+ (blue line) was added to induce Ca2+ efflux from mitochondria. This concentration of Na+ was chosen based on the reported mtNCX Km~8–10 mM for Na+ and the findings that 20 mM Na+ produces maximal activation of mtNCX in various tissues [6]. (C) Summary of the maximal rates of mitochondrial Ca2+ efflux induced by Ru360 alone (dark blue circles), 20 mM Na+ without (orange circles) or with 30 µM CGP37157 (orange squares), 20 mM Li+ without (light blue circles) or with 30 µM CGP37157 (light blue squares), in the continuous presence of 10 µM Ru360. (D) The amount of Ca2+ extruded from mitochondria during a 30 min period (T30 in (A), dotted vertical lines) after the addition of 20 mM Na+ (orange bar), Li+ (blue bar), without or with 30 µM CGP37157 (striped bars). Data are presented as mean ± SEM, n=6–8 independent experiments; ****p<0.0001, one-way ANOVA with Bonferroni’s post hoc test.
