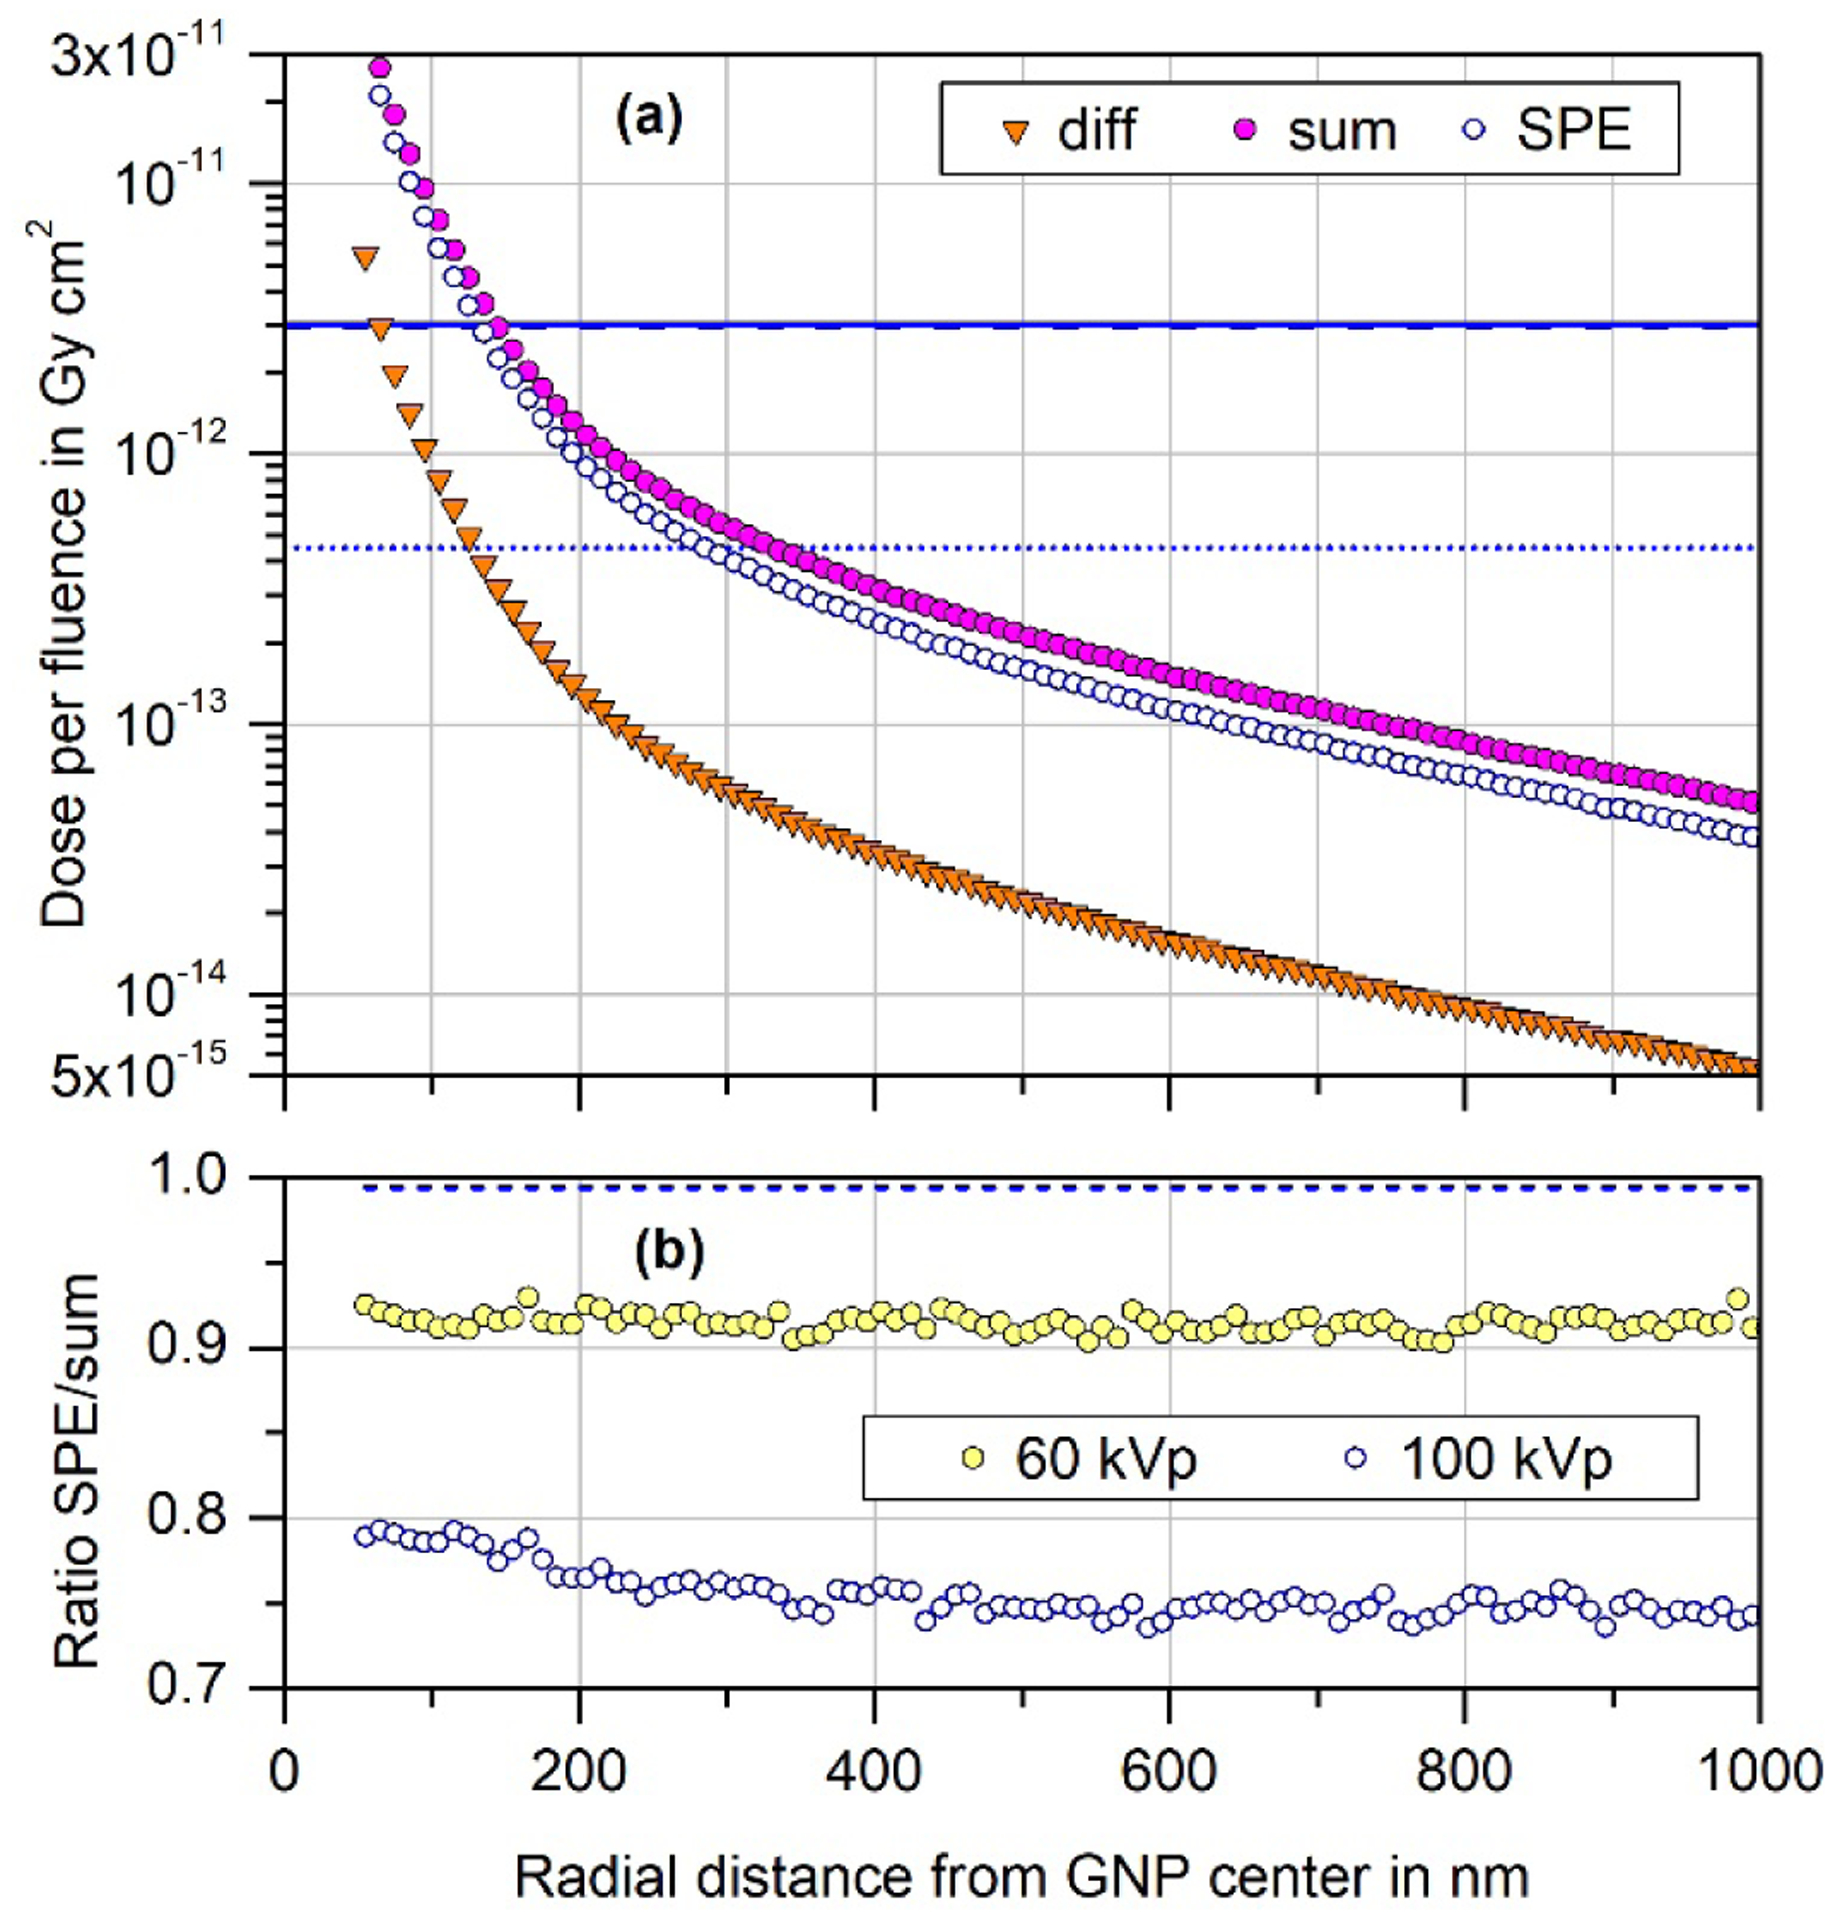
Fig. 5:

(a) Difference between the simulation results of participant G1 for a 100 nm GNP present or absent in water traversed by a circular 100 kVp photon beam of diameter 110 nm (downward triangles). The open circles are the corrected values obtained by estimating the contribution of scattered photons with the procedure described in Section 2.3. The filled circles are obtained if the scattered photon spectrum is given by the primary 50 kVp spectrum multiplied by a factor such as to give the same collision kerma in gold as for the open circles. The horizontal lines indicate the dose per fluence to water if CPE (dotted) and SPE (solid, dashed) exist. (b) Radial variation of the ratio of the excess dose per fluence due to photon interactions with the GNP calculated with the estimated scattered photon spectrum to the one obtained with the scaled 50 kVp spectrum. Open circles indicate the ratio of the data shown in the upper part of the figure as open and filled circles. Filled circles indicate the corresponding ratio that is obtained for the 60 kVp primary spectrum when using a scaled 50 kVp spectrum instead of the scattered photon spectrum obtained with the procedure in Section 2.3. The dashed lines indicates the ratio of the values of dose per fluence to water obtained with the scattered photon spectrum according to Section 2.3 to that obtained with the scaled 50 kVp spectrum, both for the case of the 100 kVp primary spectrum.
