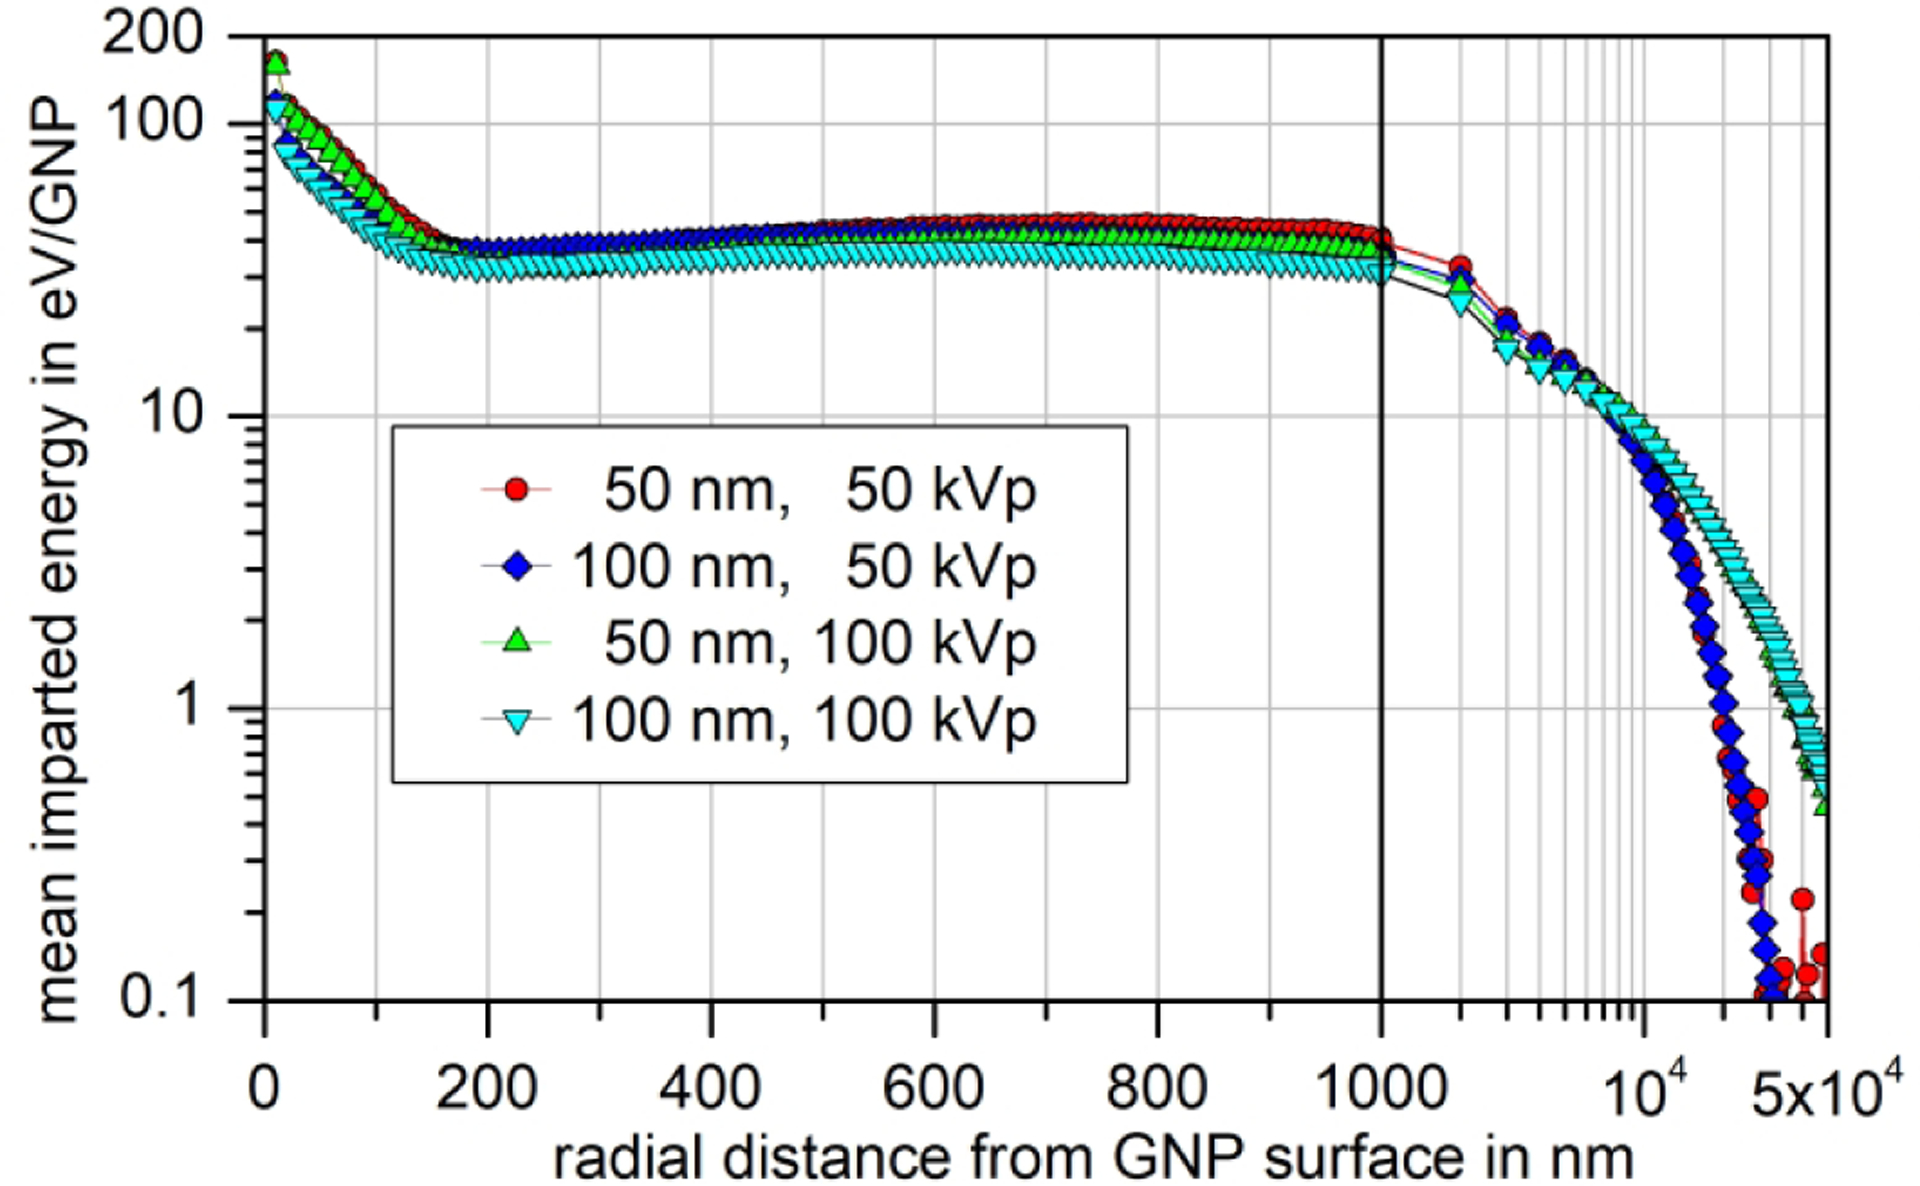
Fig. 7:

Synopsis of the mean imparted energy in 10 nm-thick spherical shells around a GNP undergoing a photon interaction for two GNP sizes and photon energy spectra. The data points correspond to the means of participants’ results that passed the consistency checks (i.e. data shown as dot-dashed lines in Fig. 6). The solid vertical line indicates a change from a linear to a logarithmic x-axis. In the right panel, the data points indicate the average over the 1 μm-thick spherical shells used in the simulations for radial distances exceeding 1000 nm.
