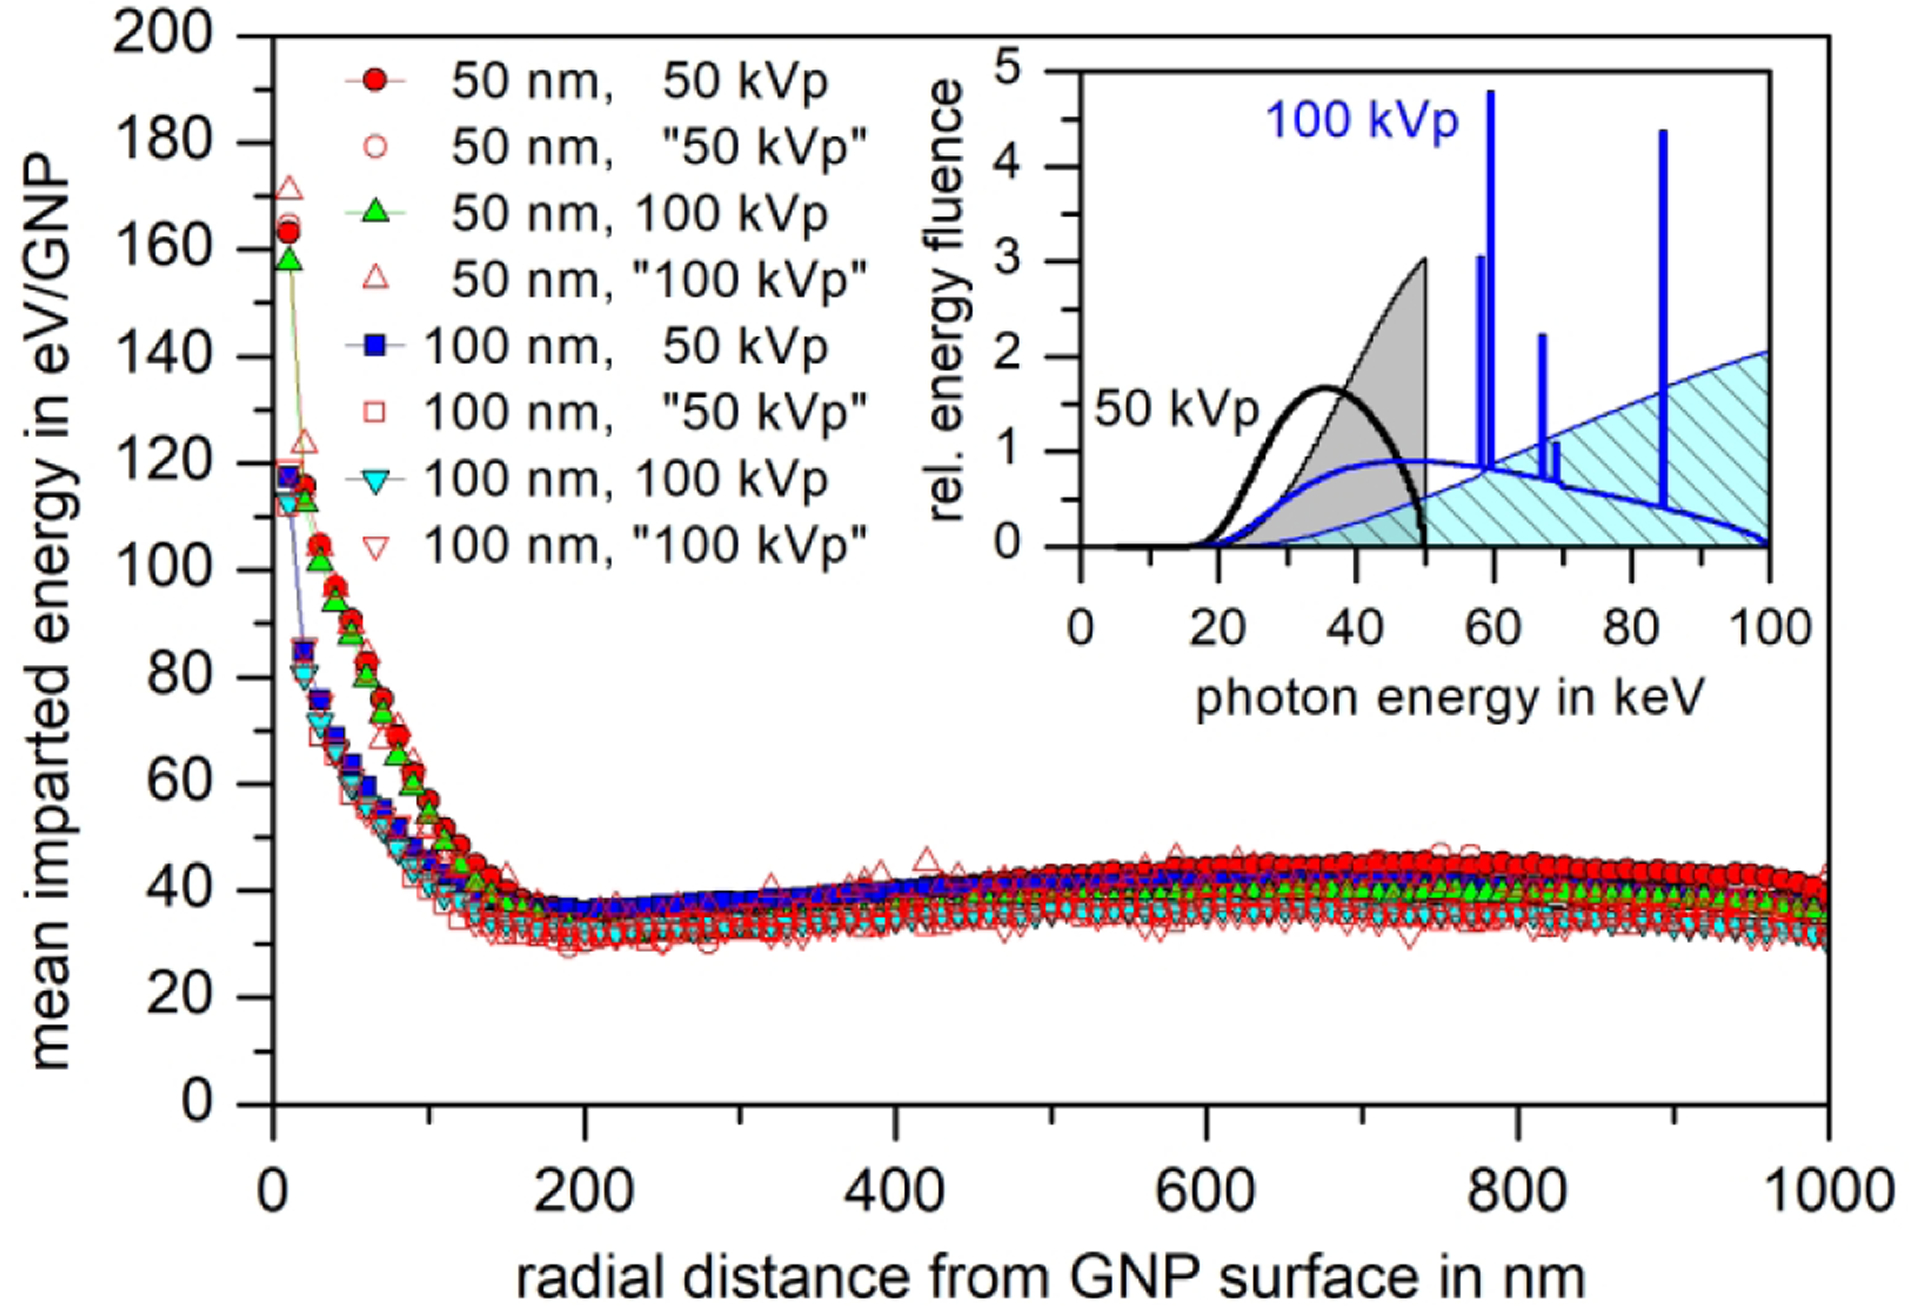
Fig. 8:

Close-up of the mean imparted energy in 10 nm-thick spherical shells around a GNP that undergoes a photon interaction. In addition to the data shown in Fig. 7, the data derived from the original results of participant P2 are also included (open symbols). The inset shows the ratio of energy and particle fluence for the respective photon sources (shaded areas) compared to the spectra required in the exercise (lines).
