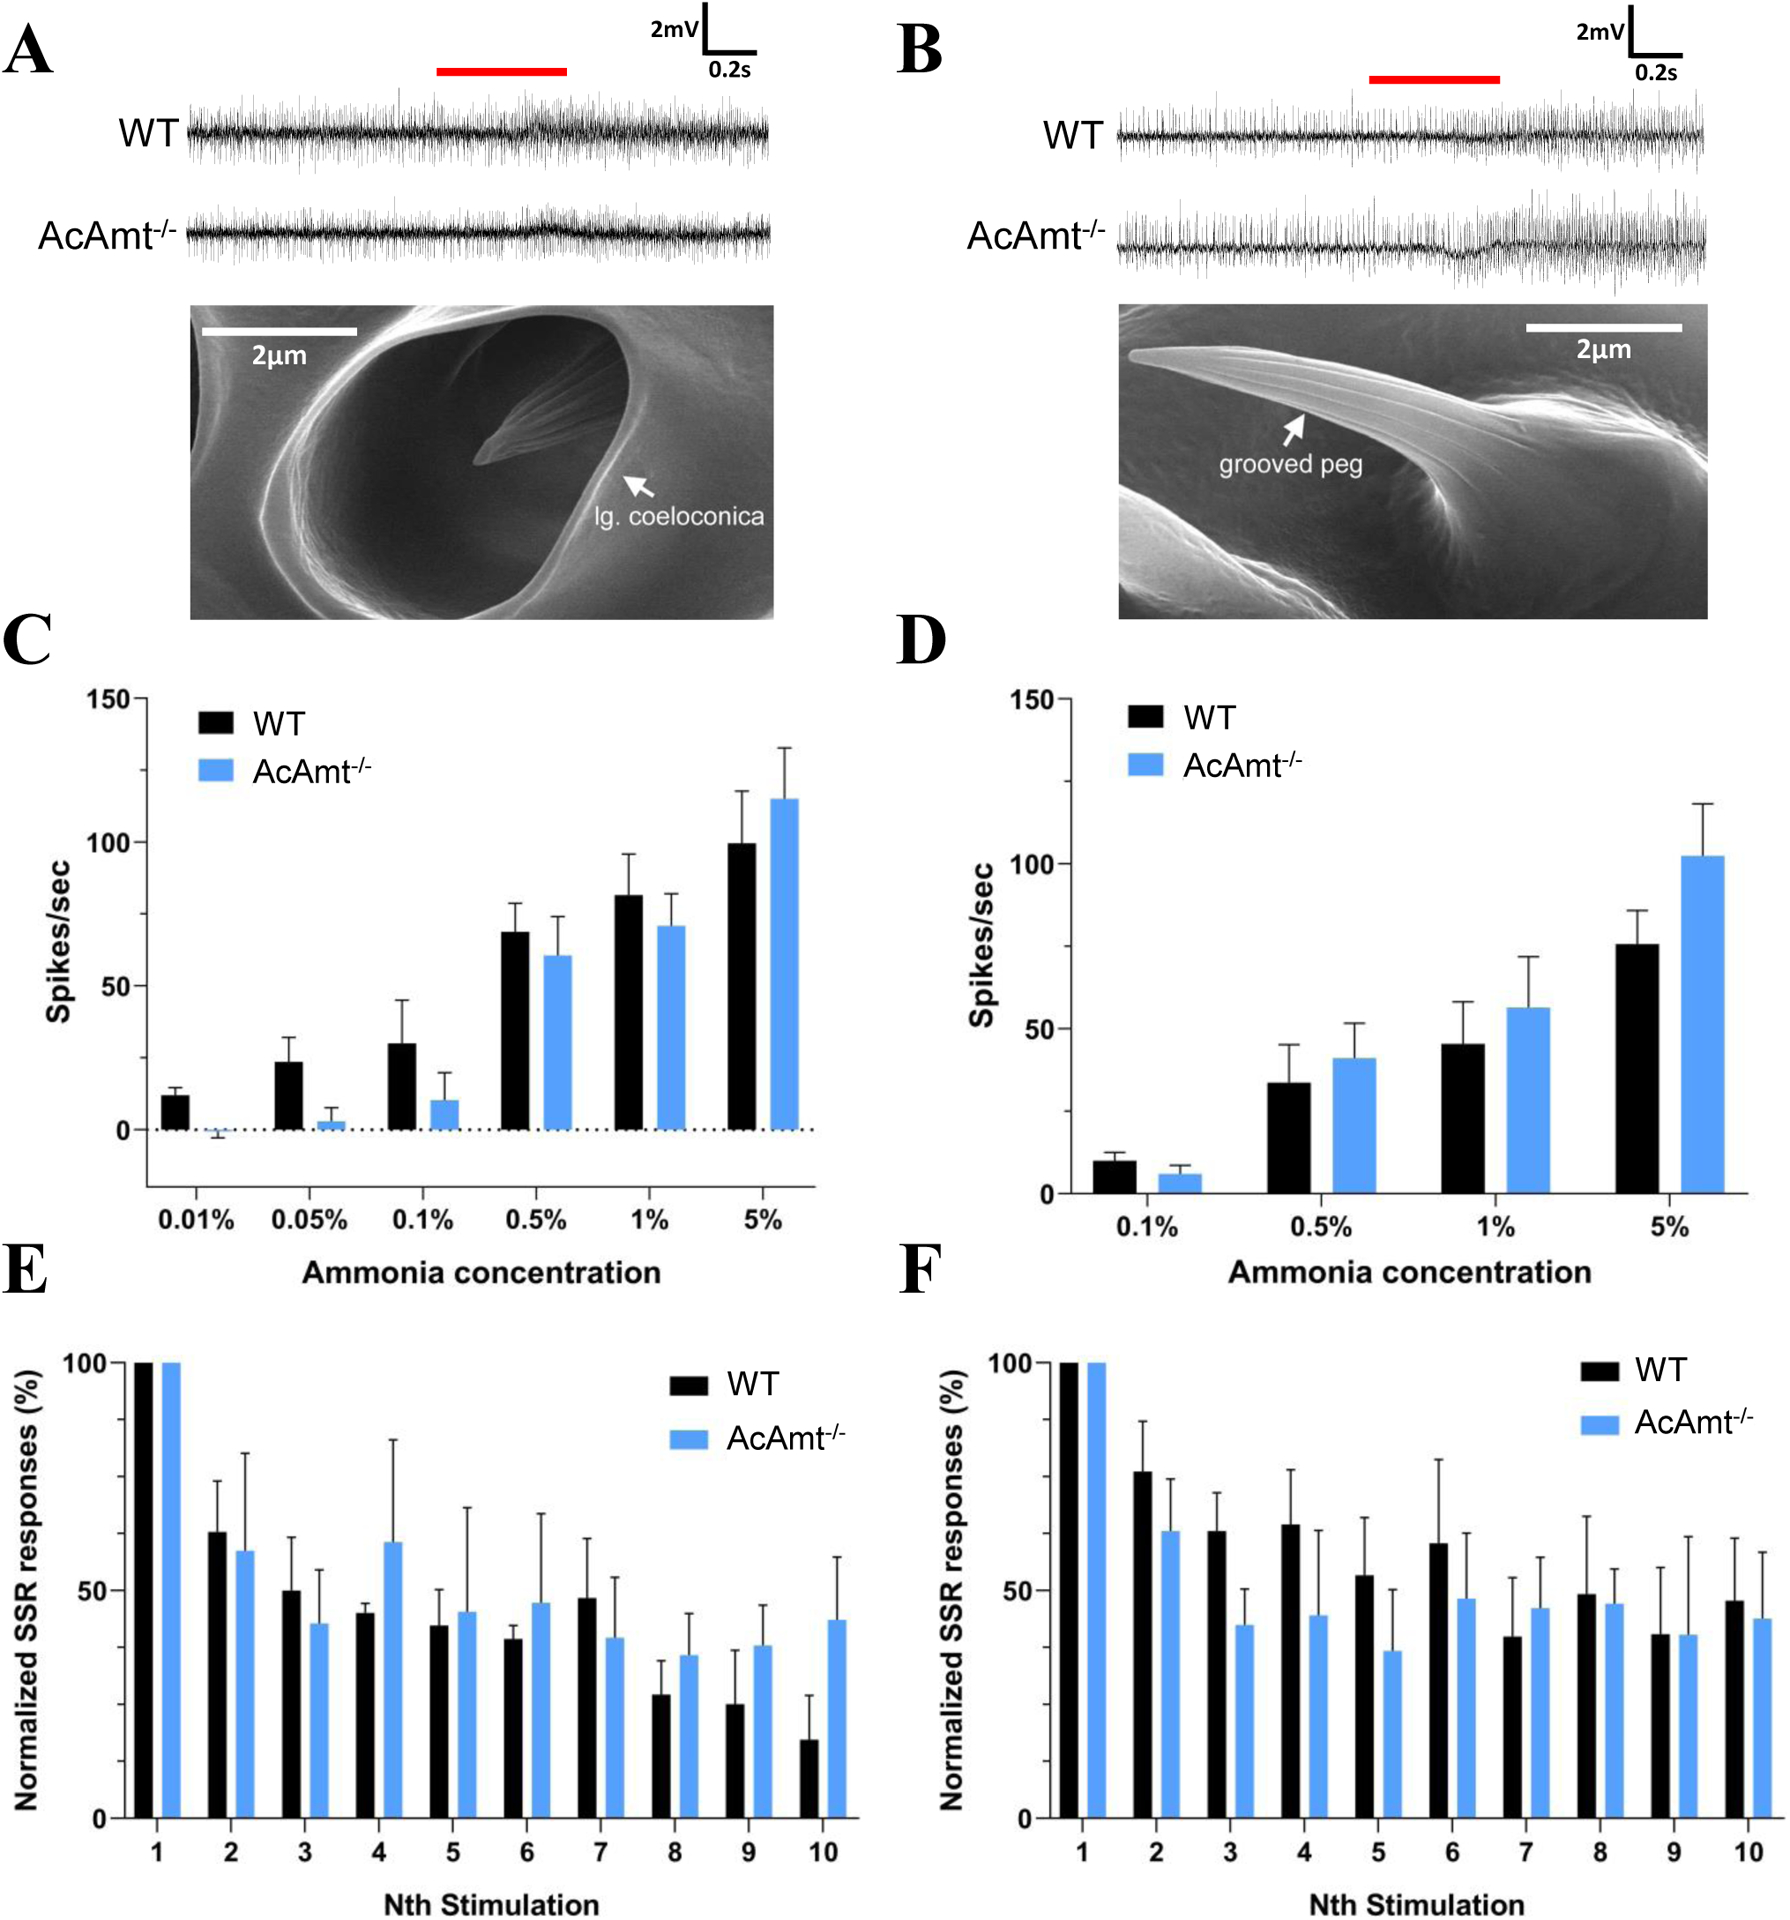
Figure 2.

(A) Representative single-sensillum recordings of coeloconic sensilla to 1% ammonia. Red bar indicates the duration of stimulations (0.5s). The scanning electron microscopy image showing the structure of a coeloconic sensillum is adopted from (Pitts and Zwiebel, 2006); (B) Representative single-sensillum recording responses of grooved pegs to 0.5% ammonia. Red bar indicates the duration of stimulations (0.5s). The scanning electron microscopy image showing the structure of a grooved peg is adopted from (Pitts and Zwiebel, 2006); (C) Single-sensillum responses of coeloconic sensilla to ammonia at different concentrations (N=5–7 for each concentration); (D) Single-sensillum responses of grooved pegs to ammonia at different concentrations (N=7–9 for each concentration); (E) Multiple single-sensillum responses of coeloconic sensilla to 1% ammonia with 5-s intervals (N=3). The responses were normalized to the fraction of the first stimulation; (F) Multiple single-sensillum responses of grooved pegs to 0.5% ammonia with 5-s intervals (N=3–5). The responses were normalized to the fraction of the first stimulation. Multiple t-tests with Holm-Sidak method suggest no significant differences (P > 0.05) between the wild-type and AcAmt−/−. Error bars = Standard error of the mean.
