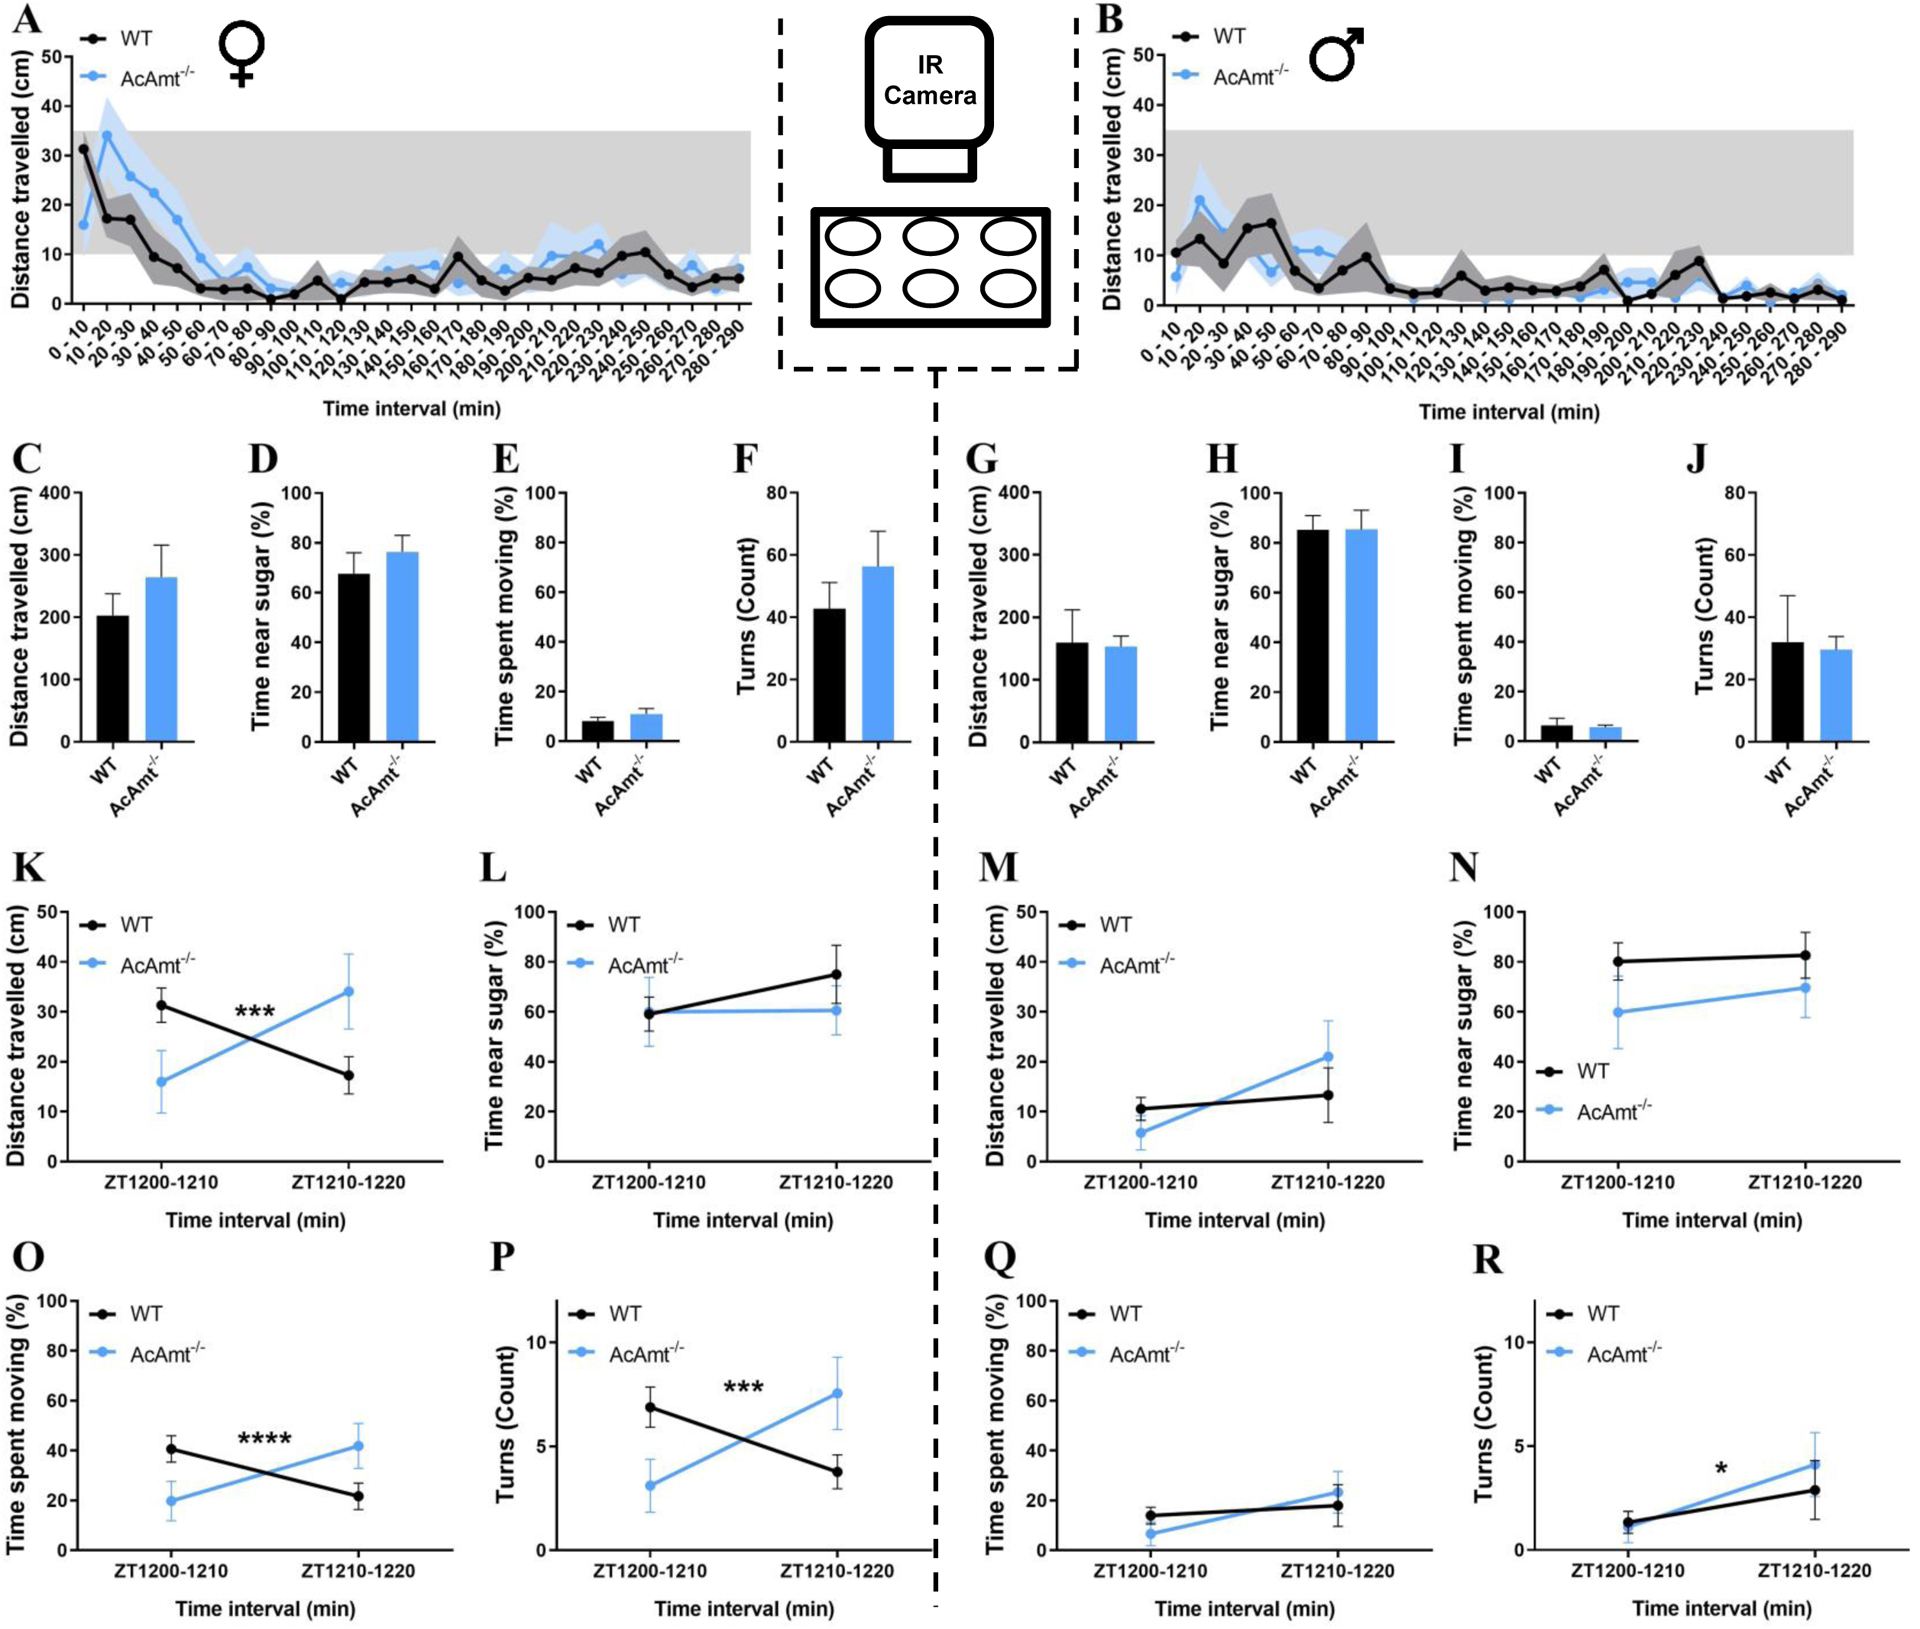
Figure 6.

(A-B) Video recordings of individual mosquitoes showing distance travelled during the activity bioassay for wild-type and AcAmt−/− mutant females (A) and males (B) organized into 10-min bins. Sex-specific data are separated by dashed lines. (C-J) Mobility parameters, including mean distance travelled (cm), time spent near the sugar water (%), time spent moving (%), and turning frequency (count) for females (C-F) and males (G-J) over the full duration of the bioassay (N=9; t-test with Welch’s correction); (K-R) Mobility parameters for females (K-L, O-P) and males (M-N, Q-R) over the first 20 min of the dark cycle organized into 10-min bins (N=9; Two-way repeated measures ANOVA; * < 0.05. *** = 0.0001. **** < 0.0001). Error bars = Standard error of the mean.
