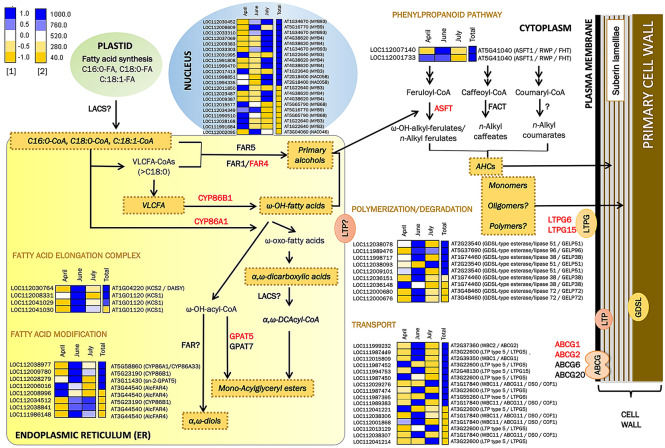
Figure 2.
Expression pattern along the cork growing season of genes involved in suberin-related processes. For each gene, the relative expression pattern (April, June and July)1 and the total expression2 of normalized read counts are shown as a heatmap, in which blue and yellow colours represent high and low expression values, respectively. The genes with demonstrated function identified in the cork transcriptome are highlighted in red. AHCs = alkyl hydroxycinnamates; VLCFA = very long chain fatty acid. The heatmaps were constructed using the EXPANDERS software75.

