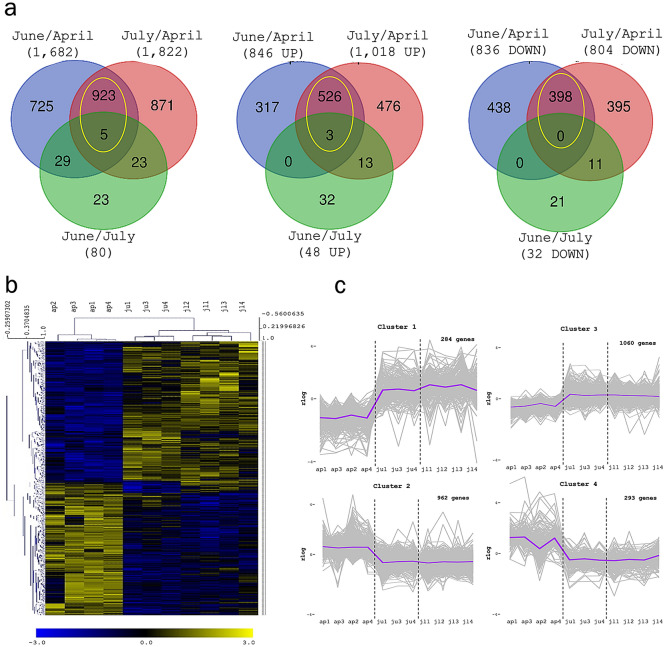
Figure 3.
Differential expression along the cork growing season. (a) Venn diagrams showing DEGs, upregulated (UP) and downregulated (DOWN), between June/April, July/April and June/July. The yellow circle includes the genes identified in both June/April and July/April comparisons. (b) Hierarchical clustering of cork samples based on the expression of DEG along the growing season. C. K-means clusters of co-expressed genes in April, June and July. Cluster 1 and 3 contain genes downregulated in April and upregulated in June and July, whereas cluster 2 and 4 showed the opposite pattern containing genes upregulated in April and downregulated in June and July.

