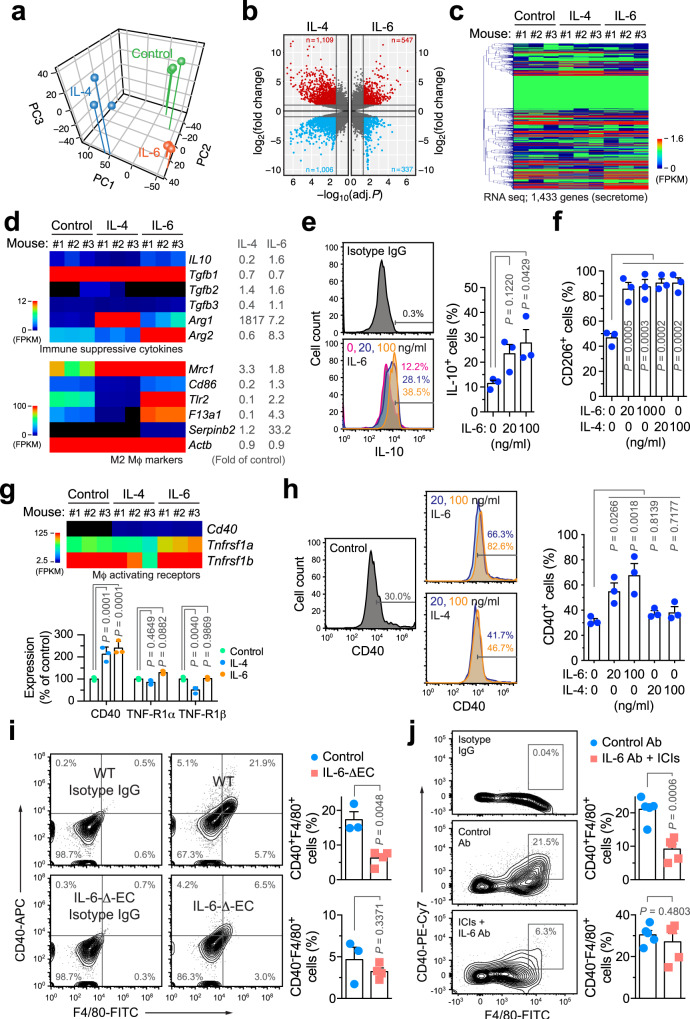
Fig. 3. IL-6 induces Mϕ-mediated immunosuppression but stimulates CD40 expression.
a–e Bone marrow (BM)-derived Mϕs were isolated from mice and treated with 50 ng/ml IL-4 and IL-6 for 2 days, followed by RNA-seq analysis (n = 3 mice). Genes were mapped and subjected to a principal component and b volcano plot analyses. c Heatmap of secretome genes. d Expression of immunosuppressive cytokines (top) and M2 Mϕ activation-associated genes. Left, heatmap. Right, means of fold expression of control. e, f BM-derived mouse Mϕs were treated with IL-4 and IL-6 for 2 days, and analyzed by flow cytometry. e IL-10 expression. Left, representative sortings. Right, quantitative results (n = 3 mice, mean ± SEM). Statistical analysis by one-way ANOVA with Dunnett’s test. f CD206 expression (n = 3 mice, mean ± SEM). Statistical analysis by one-way ANOVA with Dunnett’s test. g Expression of Mϕ activation-associated receptor genes. Left, heatmap. Right, quantitative results (n = 3 mice, mean ± SEM). Statistical analysis by two-way ANOVA with Dunnett’s test. h BM-derived mouse Mϕs were treated with IL-4 and IL-6, and analyzed by flow cytometry. Left, representative sortings. Right, quantitative results (n = 3 mice, mean ± SEM). Statistical analysis by one-way ANOVA with Dunnett’s test. i GBM was induced in control WT or IL-6-ΔEC mice. Two weeks after tumor implantation, tumor-derived single-cell suspensions were analyzed by flow cytometry (mean ± SEM, n = 3 mice for control group and n = 4 mice for IL-6-ΔEC group). Statistical analysis by two-tailed Student’s t-test. j GBM was induced in mice. Two days after treatment with IL-6 Ab and ICIs or with control Ab, tumors were analyzed by flow cytometry (n = 5 mice, mean ± SEM). Statistical analysis by two-tailed Student’s t-test. Source data are provided as a Source data file.

