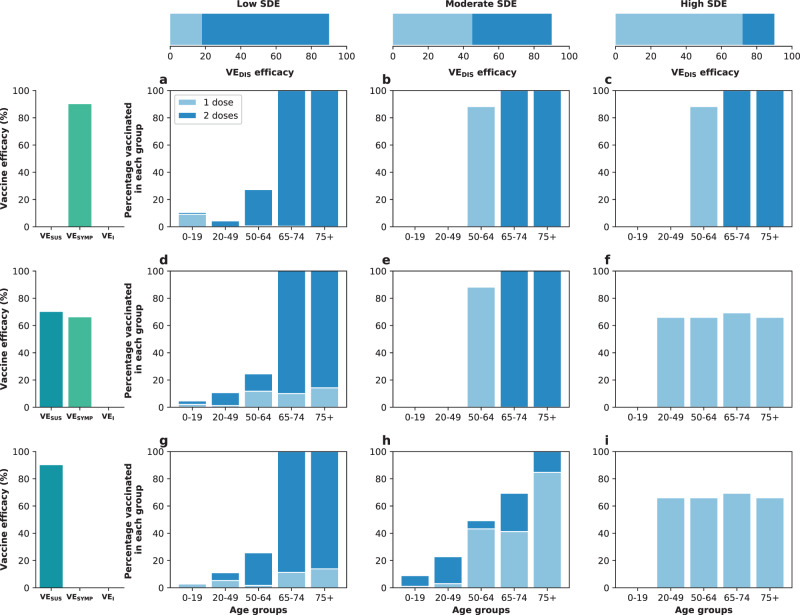
Fig. 9. Optimal vaccine allocation to minimize deaths for different vaccine profiles with 50% coverage.
Optimal vaccine allocation for minimizing deaths assuming enough vaccine to cover 50% of the population with a single dose (25% with two doses). For each panel (a–i), the bars represent the total percentage of the population in each vaccination group to be vaccinated, split in those receiving a single dose (light blue) and those receiving two doses (dark blue). Each row represents a different breakdown of vaccine efficacy against disease after two doses VEDIS = 90% as a function of the vaccine efficacy reducing susceptibility to infection, VESUS, and the vaccine efficacy reducing the probability of developing COVID-19 symptoms upon infection, VESYMP. Top row (a–c): VEDIS is exclusively mediated by a reduction in symptoms upon infection. Middle row (d–f): VEDIS is mediated by a combination of reduction in susceptibility to infection and reduction of symptoms upon infection. Bottom row (g–i): VEDIS is exclusively mediated by a reduction in susceptibility to infection. The columns correspond to assumptions that the single-dose efficacy (SDE) is low (left column, = 18%), moderate (center column, = 45%) or high (right column, = 72%), corresponding 20%, 50%, or 80% of the full vaccine efficacy, VEDIS = 90% assumed following two doses of vaccine, respectively. Here, we assumed an effective reproductive number Reff = 1.1.

