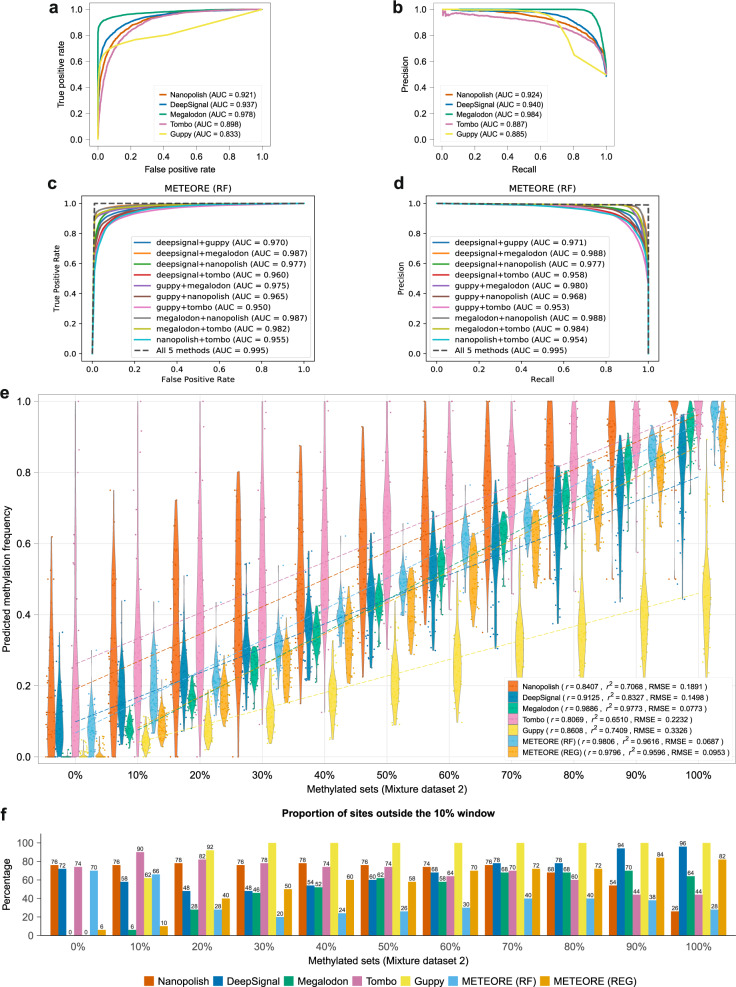
Fig. 3. Model accuracy at the individual read level and per-site accuracy analysis on control mixture dataset 2.
a Receiver operating characteristic (ROC) curves showing the false-positive rate (x axis) and true positive rate (y axis) for the predictions at individual read levels for the five methods tested, using reads from 0 and 100% methylated sets. b Precision–recall (PR) curves showing the recall (x axis) and precision (y axis) for the predictions at individual read levels for the five methods tested, using reads from 0 and 100% methylated sets. c ROC curves for METEORE for the random forest (RF) model (parameters: max_depth = 3 and n_estimator = 10) combining two methods, as well as combining the five methods. The curves were built from the average of a tenfold cross-validation with mixture dataset 1. Similar plots for another RF model using default parameters and a regression (REG) model are shown in Supplementary Fig. 3. d PR curves for the same models as in c. e Violin plots showing the predicted methylation frequencies (y axis) for each control mixture set with a given proportion of methylated reads (x axis) from the mixture dataset 2 for the five tested tools plus METEORE combining Megalodon and DeepSignal using a random forest (RF) or a regression (REG) model. The Pearson’s correlation (r) and coefficient of determination (r2) are given for each tool. f We indicate the proportion of sites predicted outside a window around the expected methylation proportion, i.e., a site in the m% dataset was “outside” if the predicted percentage methylation was outside the interval [(m − 5)%, (m + 5)%] for intermediate methylation sets, or outside the intervals [0,5%] or [95%,100%] for the fully unmethylated or fully methylated sets, respectively. The percentage is indicated on top of each bar, except for 100%.

