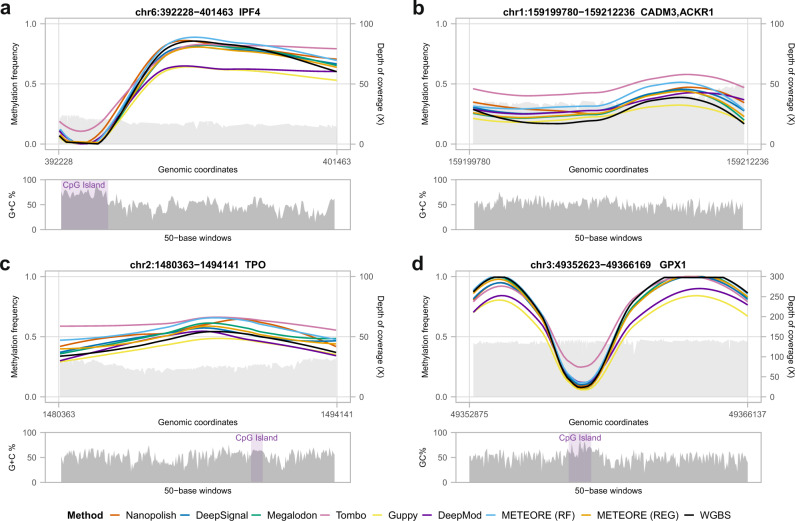
Fig. 5. Comparison of CpG methylation predictions from nanopore with whole-genome bisulfite sequencing (WGBS) along Cas9-targeted regions.
Locally estimated scatterplot smoothing (LOESS) line plots of methylation calls frequency predictions (left y axes) from WGBS Illumina and from nanopore data using seven tools: Nanopolish, DeepSignal, Megalodon, Tombo, Guppy, DeepMod, and METEORE random forest (RF) and regression (REG) models. The plots include the nanopore read coverage (right y axes), shown as a light gray area. The panels below show the GC content of the region, using a window size of 50 bases. a–c Three of our ten target regions and d one of the eight target regions from Gilpatrick et al.18. The depicted regions are a chr6:392228-401463, which covers the first and second introns of gene IRF4; b chr1:159199780-159212236, which covers the genes ACKR1 and CADM3; c chr2:1480363-1494141, which covers the gene TPO; and d chr3:49352525-49366169, which covers the genes GPX1. A zoom in of the LOESS line plots with the individual methylation calls and logos for the sequence context around the CpG site in four CpG islands (CGIs) of our target regions are shown in Supplementary Fig. 15.

